Discover and read the best of Twitter Threads about #TorontoRealEstate
Most recents (15)

Rich immigrants who moved to #Vancouver through Quebec's back-door investor program now own, on avg, $4.6m worth of housing. But they're only paying taxes on annual incomes of a paltry $100k. A gov.-enabled scam. Via @GoldinYVR, #vanre #vanpoli #cdnpoli theglobeandmail.com/real-estate/va…
2/ @Ayan604 says the system is failing new immigrants who’ve arrived to work and settle, if it also allows new immigrants who are here (simply) because they are wealthy and have an appetite for real estate investment. #vanre #torontorealestate #onpoli #Cdnimm #bcpoli #vanpoli
3 / And what's more ... Quebec gets 10 times more than B.C. and Ontario to settle immigrants. #ICYMI #BCpoli #Cdnimm #cdnpolitics #onpoli #abpoli #qcpoli #immigration.
vancouversun.com/business/dougl…
vancouversun.com/business/dougl…

Insight on bidding wars in Toronto. 🧵
B4 listing a home the seller & agent discuss listing strategy.
1. List w low price, set offer date. Low price brings traffic, usually lots of it. Some serious buyers & many who “hope” they can buy at or near list price. #torontorealestate
B4 listing a home the seller & agent discuss listing strategy.
1. List w low price, set offer date. Low price brings traffic, usually lots of it. Some serious buyers & many who “hope” they can buy at or near list price. #torontorealestate
2/ Option 2, list at or just above what u want & wait. This is usually done when mrkt is moving slower, more homes available.
The reasons sellers will choose #1.
👉🏼supply vs demand. Low supply, plenty of buyers brings lots of showings. It’s a # game. Get 50ppl in to 👀home
The reasons sellers will choose #1.
👉🏼supply vs demand. Low supply, plenty of buyers brings lots of showings. It’s a # game. Get 50ppl in to 👀home
3/ higher chance of multiple offers & maybe selling it more than its worth.
👉🏼if everyone else is underpricing in ur neighbourhood & u price higher at true value buyers may think ur asking too much. So go w the flow. Especially when ur neighbour received 16 offers last week.
👉🏼if everyone else is underpricing in ur neighbourhood & u price higher at true value buyers may think ur asking too much. So go w the flow. Especially when ur neighbour received 16 offers last week.
Every time I meet with a new buyer lately one of the main concerns I hear (understandably) is how to avoid overpaying for their next home.
I thought it would be helpful to breakdown a solution to this problem.
Here is a 🧵 on 👉🏼HOW TO AVOID OVERPAYING FOR YOUR NEXT🏡
1/
I thought it would be helpful to breakdown a solution to this problem.
Here is a 🧵 on 👉🏼HOW TO AVOID OVERPAYING FOR YOUR NEXT🏡
1/
Before you bid on your next home your Realtor should create a detailed Comparative Market Analysis (CMA). The goal of a CMA is to understand the homes true value before you decide to buy it. List price in the GTA is just that, a list price. Doesn’t always reflect true value.
2/
2/
A CMA is similar to what a appraiser does for a bank or mortgage lender before they approve you for a mortgage. The lender wants to make sure the home you are purchasing is worth the money they are lending against it.
3/
3/

TRREB has released its September #torontorealestate numbers. They like to accentuate the stats that would indicate everything is awesome, but let me point out 5⃣ STATS SHOWING MARKET COOLING ❄️ /1 

First let me say it's not a COLD market yet by any means. But problem is everyone just likes to look at YoY change. When you think about it, 12 months is a somewhat arbitrary period to compare to. So September sales are way ⬆️(42%) and average prices are also ⬆️ (14%) /2

1⃣ AVERAGE YoY PRICE GROWTH IS SLOWING.
In July it was +16.9%
In August it was +20.1%
In September that slowed right down to +14.0%
Note a good chunk of the price growth is due to mix (less condo apts, more detached). /3
In July it was +16.9%
In August it was +20.1%
In September that slowed right down to +14.0%
Note a good chunk of the price growth is due to mix (less condo apts, more detached). /3
Some weekly #torontorealestate sales numbers in this thread. Firstly, week over week pattern this year continued to follow same as last year (only couple of deviations on here, main one being Labour Day one week later this year). /1

The total sales in the 416 in the past 4 weeks cumulative have been just 1% below 2019, with this week being flat. /2

But "tale of two cities" continues, with freehold (lowrise houses) selling stronger than last year and condos (apts and townhouses combined) selling weaker of late (and didn't show the huge "pent-up demand" that houses did. /3

Bonus Tuesday #torontorealestate chart content. Here's an update weekly 416 sales year-over-year. Can see how unusually down was during COVID, then unusually up when things started re-opening. Spike week ending 9/6 was b/c normal week this year but Labour Day week last year. /1
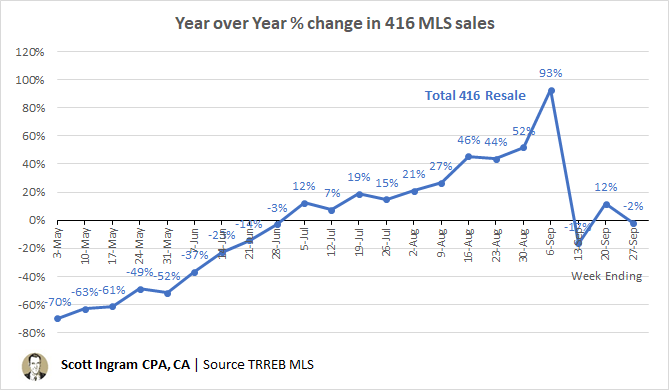
Reverse is true for week ending 9/13 (includes Labour Day this year). That blue line was condo and freehold combined. This is separated. Can see the big YoY sales increases really driven by freeholds. /2
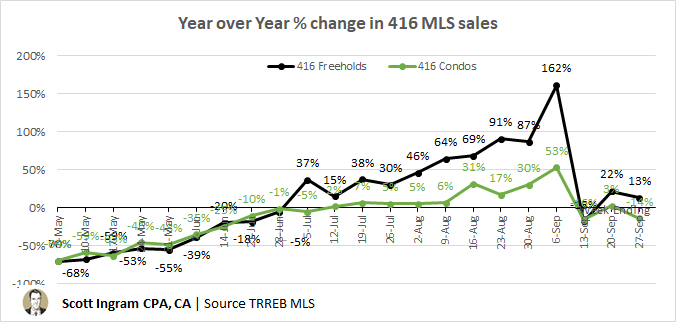
Here's a look at the absolute numbers underlying the freeholds. Post-June is consistently higher than last year. /3

Further processing Aug stats, biggest diff YoY between 416 and 905 is new listings. Total GTA reported was ⬆️57%. But you look underneath and 905 +38% and 416 nearly doubled. This is due to condos apts, which is majority of 416 sales, but not so signif in 905. /1

Also note 416 avg price (+24%) is up more than 905 (+18%) which seems weird because 905 seems stronger on most metrics. Simply due to MIX. This year's 416 Aug sales have smaller share of $ condos and larger share of $$ houses, driving up the average. #torontorealestate /2
Think of 10 coins in your hand. Last year you had more nickels, this year you have more quarters so your 10 coins are worth more on average. /3

Looking at TRREB's newly released charts. Couple of #TorontoRealEstate observations...
If you ignored all the months around it and how it got there, June would pass as a normal-looking month for sales. /1
If you ignored all the months around it and how it got there, June would pass as a normal-looking month for sales. /1

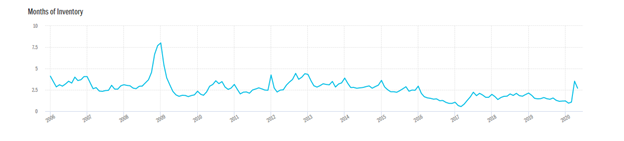
The last 5 months of SNLR look fairly normal-ish too. (Higher is hotter, lower is cooler, many say 40% to 60% is more balanced territory. I don't like this stat because re-listings distort New Listings so it's impure.) /2

You can see 2020 price have been hanging out in that rarefied air only seen in early 2017. /3


My bear case for Condos market in Tor
1- Pre-constructions: According to Urbanation Condo rprt in May. We have unsold inventory 13K units, 92% of the 76k units under construction pre-sold. As well, the 33K units in pre-construction were 79% sold = met financing targets./1 #tore
1- Pre-constructions: According to Urbanation Condo rprt in May. We have unsold inventory 13K units, 92% of the 76k units under construction pre-sold. As well, the 33K units in pre-construction were 79% sold = met financing targets./1 #tore
A record 29K (revised down to 25k) new condos were scheduled for occupancy in 2020 in the GTA by Q3, more than Half of units pre-sold to Investors, so plenty of "investors" supply to hit the market this year /2
2- Resell: While the MOI was low in May, it was the highest since 2015 . Condo inventory rising rapidly since May 1st and accelerated since June 1st, in the last 2 weeks, the new listings is much higher than last year. Vaughn sitting on 15MOI(sals 2-4 week, inventory higher YOY)


Okay, weekly 👀 at Sold-Over-Asking (SOA) numbers in the 416. I manually track this one way to heat-check the market, and I noticed back in wild 2017 that you could see things changing on a weekly basis. Same holds true now. First off here's Freeholds selling 20% or more OA.

Maybe the 25% in the one week was a bit of a fluke (you can see things are jagged and not purely linear. But you can see definite downturn since week ending March 15 (19%). So this has cooled off. /2
Now to regular SOA (I use 1% or more OA for this. I said that last week's 67% may have been a fluke too. But the 46% last week (ending Sundays) is a definite cooling indicator. It's the lowest since January. Even if it was a bit flukey low and next week it bounces up to 51%... /3

Here we are, my top observations on the Feb 2020 #torontorealestate TRREB market stats. My conclusion was a lot of "highest this has been since 2017" but not quite that level. Some bonus charts not in blog post included in this thread. /1
areacode416homes.com/february-2020-…
areacode416homes.com/february-2020-…
Here's the percent of 416 freeholds sold over asking, one of those "highest Feb since 2017" stats I just mentioned. /2

What really stood out to me is a chart I stopped publishing because it got to the point that there was no story because it became virtually non-existent. That's sold 20% over asking. But look - it's back to being a thing. /3

TREB predictions for 2020:
1) GTA sales - calling for 97,000, which would be ⬆️9,200 (+10.5%) and make it 3rd highest volume ever.
2) GTA avg price - saying $900,000 (+9.8%). Detached (highest $ amounts) would have to get a lot higher in the mix.
TREB Prediction history... /1
1) GTA sales - calling for 97,000, which would be ⬆️9,200 (+10.5%) and make it 3rd highest volume ever.
2) GTA avg price - saying $900,000 (+9.8%). Detached (highest $ amounts) would have to get a lot higher in the mix.
TREB Prediction history... /1

I have a spreadsheet for that. 🤓 First, transactions. Let's just say they haven't been the second coming of Nostradamus. Last year was first time they were within 10% in last few years, anyway. Feeling pretty bullish going into 2020, esp. if inventory low. /2

Now price. They actually have a better record at this, nailing 2 of the last 3 years. $900K seems aggressive to me, so I'd guess they'd be banking on big sales gain in detached to pull that up. However... /3

First look at TREB's December 2019 and full year market stats, for all you late night #torontorealestate fans. Dec was a continuation of what we've been seen from Q2 through Q4.
- big sales increases over 2018
- lower listings inventory
- above leading to ⬆️price pressure /1
- big sales increases over 2018
- lower listings inventory
- above leading to ⬆️price pressure /1

-Every month this year (except Sept which was tied), 905 had a larger % sales increase than 416. But coming from much bigger lows in 2018.
-905 had bigger drop in new listings (or lower increase) in all 12 months
- Yet 416 had larger price % increase than 905, 9 months to 3. /2
-905 had bigger drop in new listings (or lower increase) in all 12 months
- Yet 416 had larger price % increase than 905, 9 months to 3. /2

Here's a representation of that sales increase being larger for 905 (orange) than 416 (blue) in all months but one (tied). Note how slow Q1 was (negative for 416, 0-5% growth for 905), then 905 took off in Q2 and stayed there. /3

416 Active listings check-in. As expected, fresh listings have bounced back after Labour Day (they get a little low at each stat holiday, then bounce back after). /1

Most pronounced in 416 Freeholds, ⬆️10.9% over last week, the largest jump since March 26. Note fresh listings (one week or less on market) have climbed from 17.6% to 32.1% of all listings. /2

416 Condos are ⬆️5.6% over last week. Though not as high as freeholds jump, is actually highest weekly % climb since Jan 22. Fresh rate jumped 9.3% to 28.9%. /3

Here's my first-look at the TREB monthly stats released today. In every way you look at it, the aggregate GTA stats show a tighter market than last year.
Sales ⬆️ Prices ⬆️
Listings ⬇️ DOM ⬇️
As I keep reminding, comparing to weak year, but still. 1/ #torontorealestate #TREBstats
Sales ⬆️ Prices ⬆️
Listings ⬇️ DOM ⬇️
As I keep reminding, comparing to weak year, but still. 1/ #torontorealestate #TREBstats

First time I can remember in a while that all housing types in both 905 and 416 being ⬆️ YoY in terms of average price. (July was ⬇️ in 416 Detached, June was ⬇️ in 416 & 905 Detached) /2

And everything but 416 semis is ⬆️ in sales volume (but we're talking only 188 transactions so the smallest of all the types so more subject to big swings). /3

