,
10 tweets,
3 min read
Read on Twitter
#TRADING Intraday - A very simple intraday trading method; No sophisticated systems / pivots / fibbonaci / indicators / EW..... etc ; This is being followed by sum of the successful intraday traders in the world and even in our markets too. The following are the steps:
NOTE; THE LEVELS ARE NOT RECOMMENDATIONS FOR NEXT DAYS TRADE. THEY ARE USED TO EXPLAIN THE CONCEPTS.
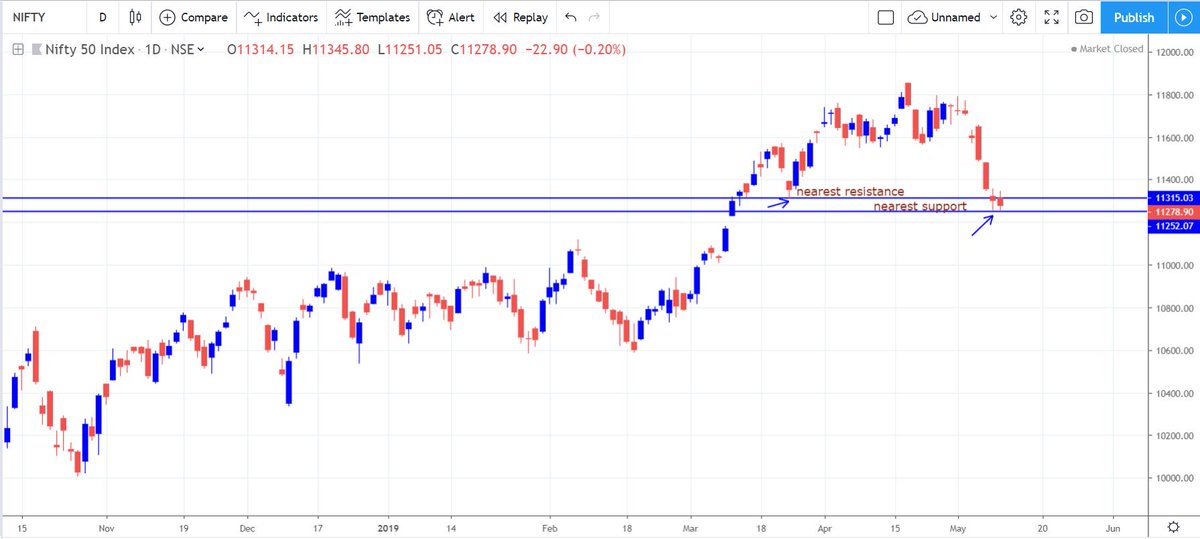
1) Open Daily Chart, say for eg.,Nifty.
2) Identify nearest support and resistance from the latest close. Mark horizontal lines (for eg, blue).
1) Open Daily Chart, say for eg.,Nifty.
2) Identify nearest support and resistance from the latest close. Mark horizontal lines (for eg, blue).
3) Now go to 1 hr chart.
4) Identify nearest support and resistance from the latest close. Mark horizontal lines with different colors (for eg., black). If S & R of 1 hr tf is same as daily tf, identify the next visible S & R in 1hr tf and mark accordingly.
4) Identify nearest support and resistance from the latest close. Mark horizontal lines with different colors (for eg., black). If S & R of 1 hr tf is same as daily tf, identify the next visible S & R in 1hr tf and mark accordingly.

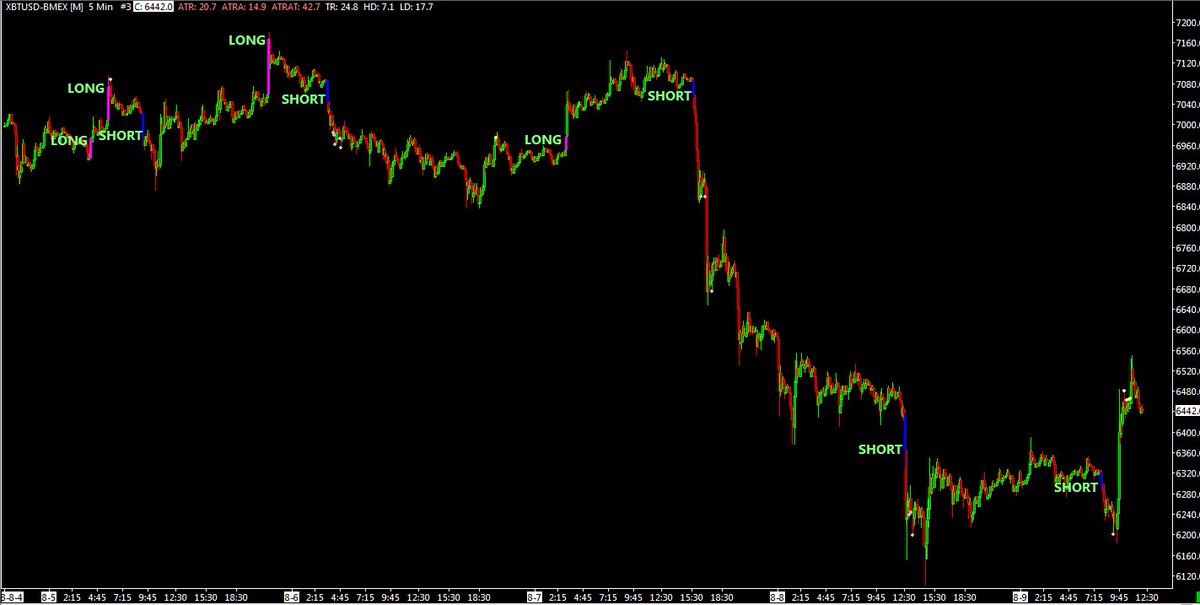
5) Now go to 5 min chart. All the support and resistance lines drawn in daily tf and 1 hr tf. In our eg., currently price is at 11279 at a support line. There is a support line at 11225 , a resistance line at 11314 and another one at 11350.

6) Now time for action. All you have to do is to look for price action at these support levels and resistance levels. Your entry should be at or close to these levels and not at any other place.
Scenario 1 - For eg., let us assume price opens at say 11290 and comes down to 11279, you should lookat price action that indicates possible reversal from this level. If you observed a reversal price action, enter at high of the reversal candle with sl few ticks below support.
Scenario 2 - If for eg, if price breaches 11279,wait for the candle to close and enter at the breach of the candle low. Alternative way is to wait for retest of 11279 and look for a bearish candle, entry should be at the low of the retest candle. sl is few ticks above resistance.
Scenario 3 - If for eg price goes to 11313, look if any reversal price action is visible; once this is confirmed go short with stop of few ticks above resistance.
Scenario 4 - If for eg price goes to 11313 and breaches above that, one can go long for a short scalp till 11350.
Scenario 4 - If for eg price goes to 11313 and breaches above that, one can go long for a short scalp till 11350.
Scenario 5 - If for eg price goes past 11313 and reaches 11350, look for any price reversal price action, once confirmed, its time to go short with stop at few ticks above resistance, ie 11355.
Scenario 6 - If for eg, price goes past 11350, its time to go long with stop at few ticks below 11350.