,
12 tweets,
25 min read
Read on Twitter
@Steve_Pinel @simonahac @JimmyZ51174789 @skaye @jpsburke @timminchin ok, let's do this.
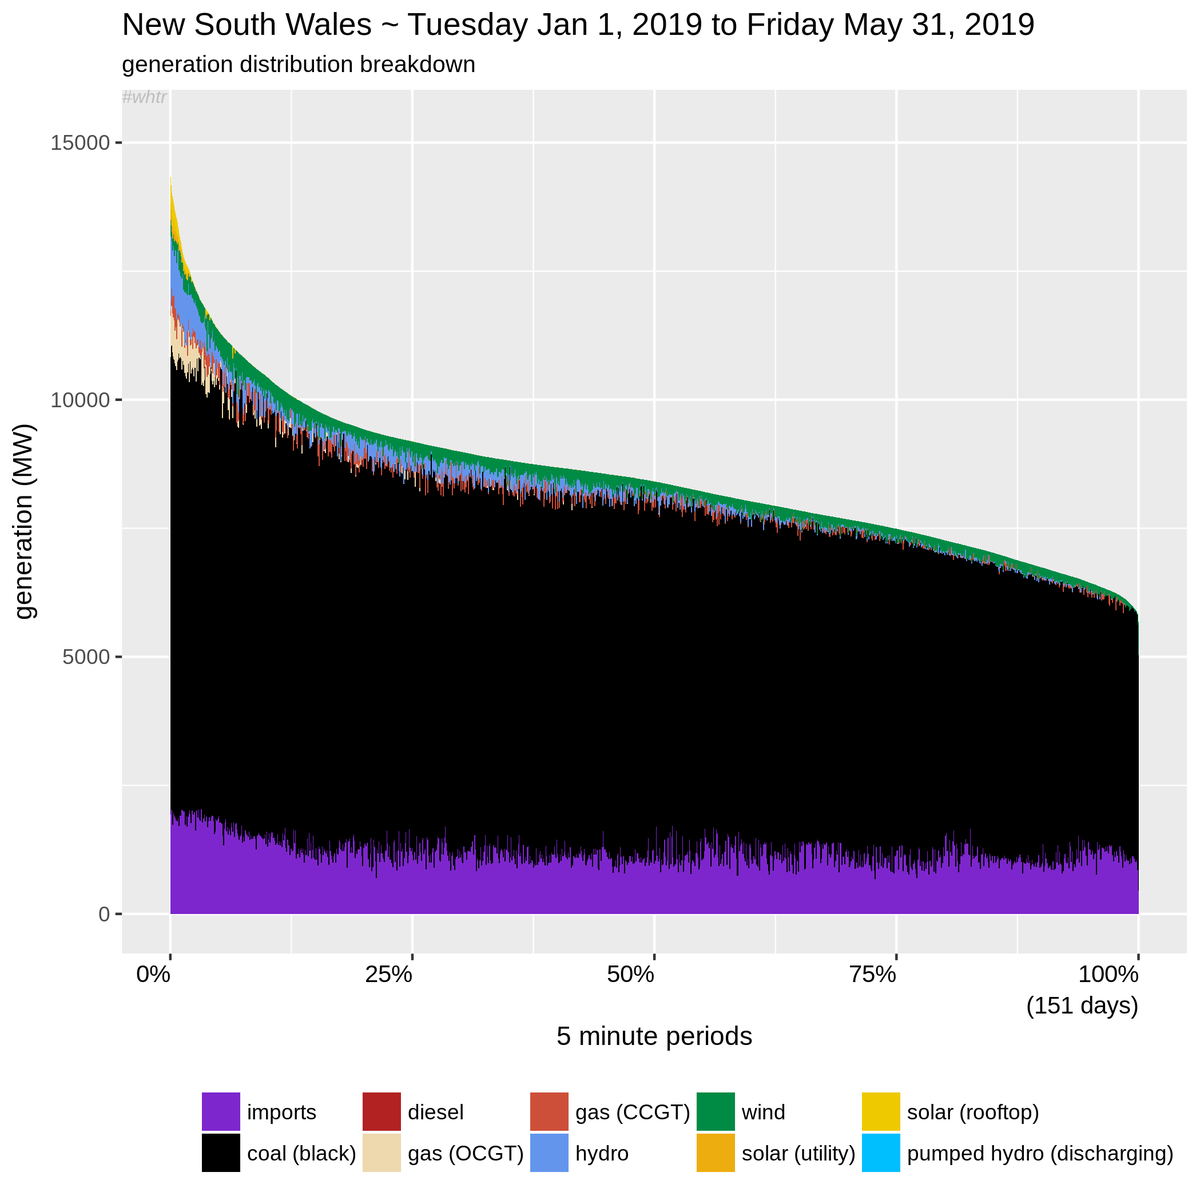
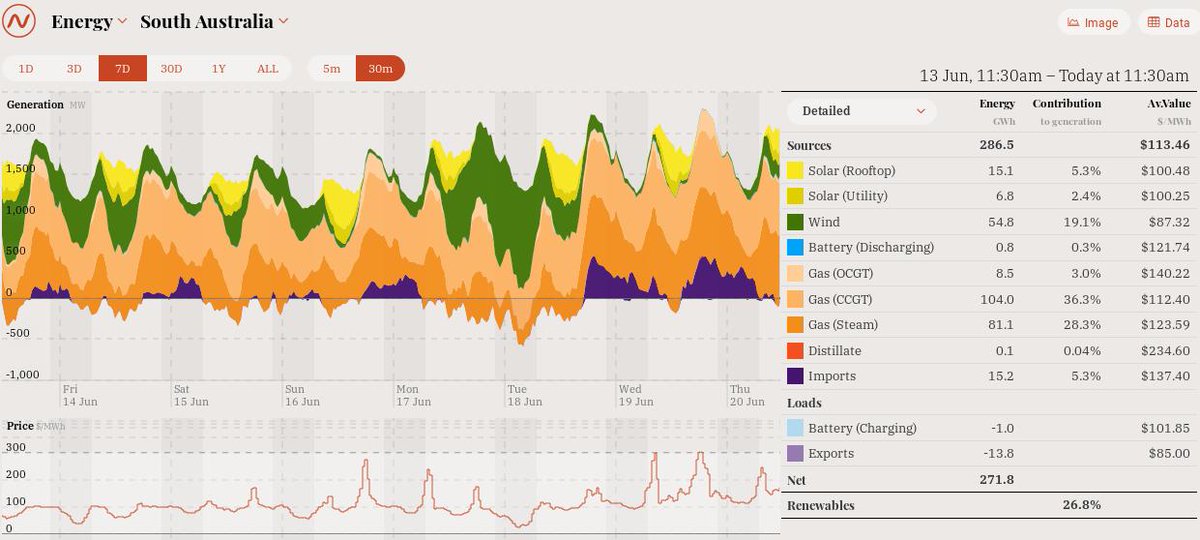
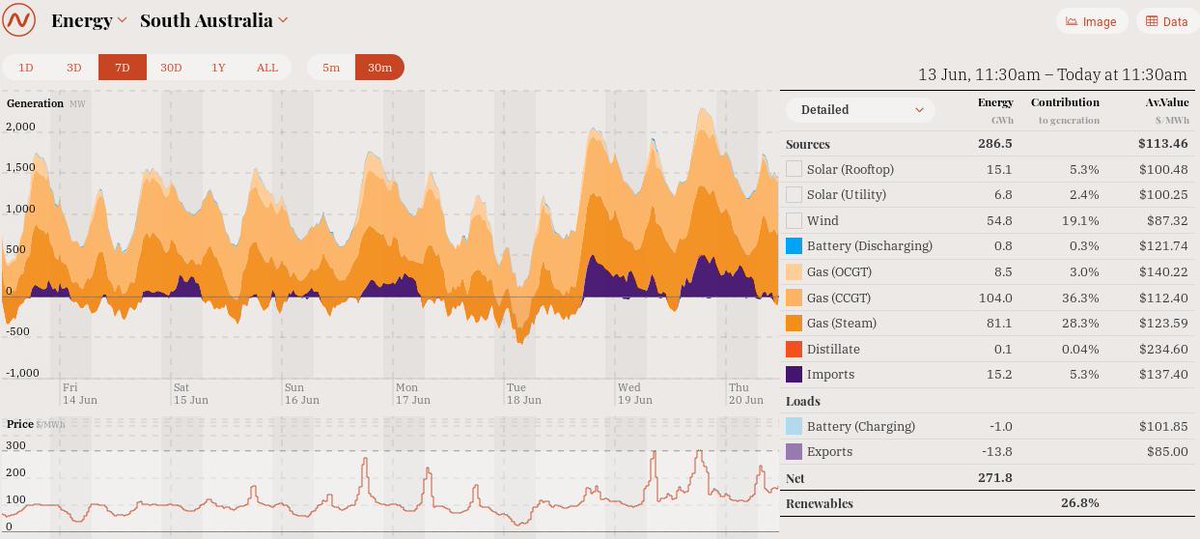
Making use of the excellent data tools at @OpenNem (that @simonahac is involved with) opennem.org.au/#/region/sa/en… & taking the in-state total demand👇 (so leaving aside exports), we reorder this data from highest to lowest.
also… @Banshee2030 & @GlenneDrover 1/×
Making use of the excellent data tools at @OpenNem (that @simonahac is involved with) opennem.org.au/#/region/sa/en… & taking the in-state total demand👇 (so leaving aside exports), we reorder this data from highest to lowest.
also… @Banshee2030 & @GlenneDrover 1/×
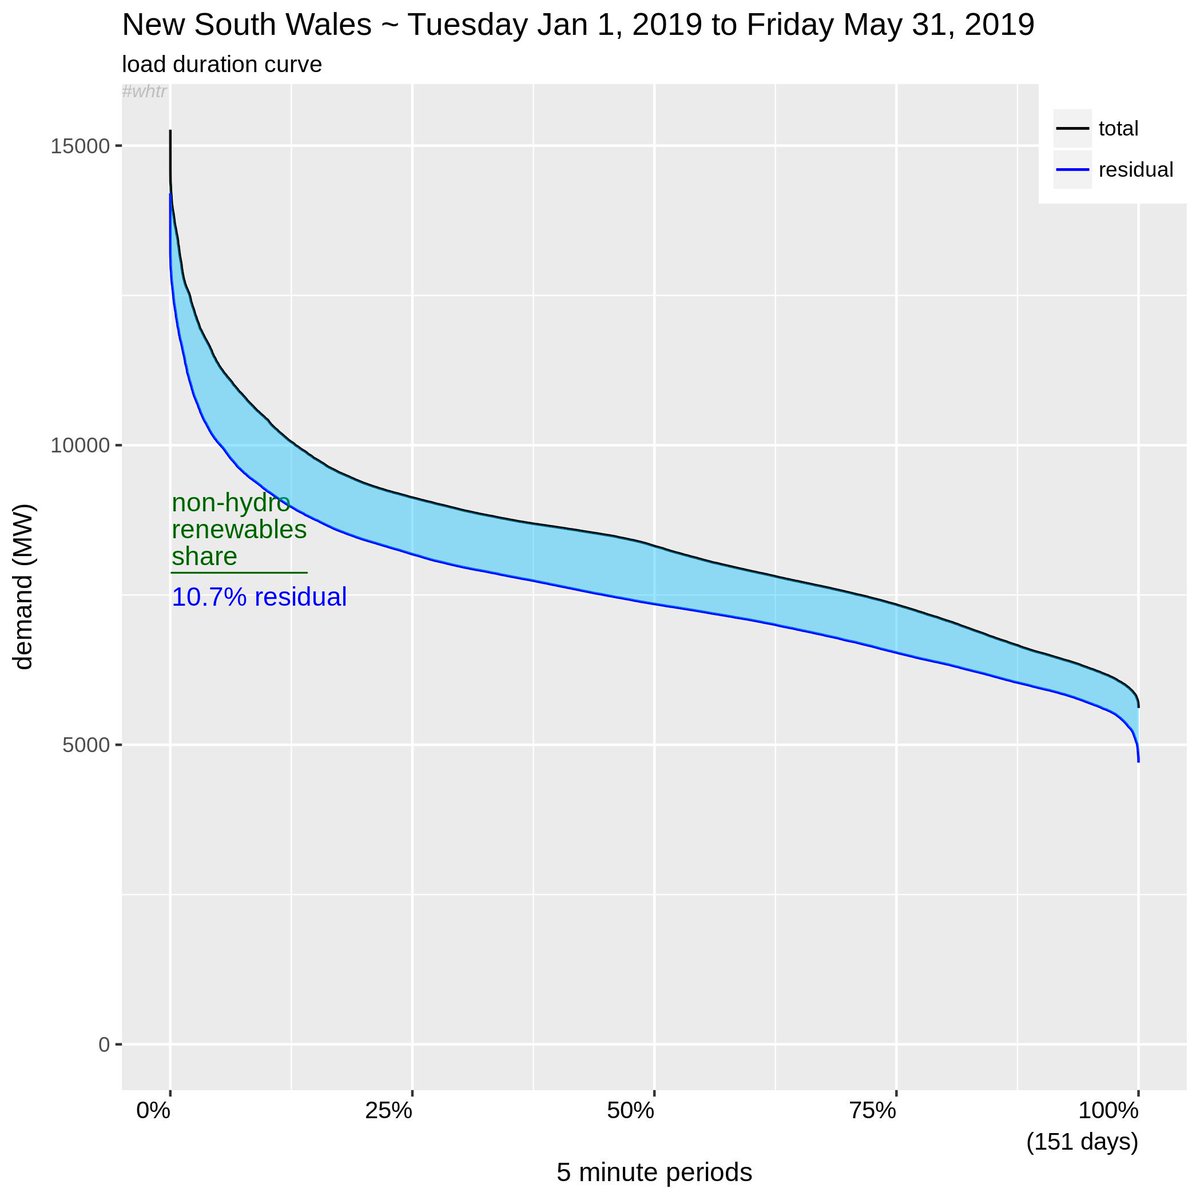
@Steve_Pinel @simonahac @JimmyZ51174789 @skaye @jpsburke @timminchin @OpenNem @Banshee2030 @GlenneDrover This reordered data gets us the total (black line) load duration curve.
It's a way of "de-noise-ing" the signal, and straight away you can see useful things. Like ~10% of the time, demand peaks above 2GW.
It's a cumulative distribution curve, rotated 90° anti-clockwise. 2/×
It's a way of "de-noise-ing" the signal, and straight away you can see useful things. Like ~10% of the time, demand peaks above 2GW.
It's a cumulative distribution curve, rotated 90° anti-clockwise. 2/×
@Steve_Pinel @simonahac @JimmyZ51174789 @skaye @jpsburke @timminchin @OpenNem @Banshee2030 @GlenneDrover Next we do the same thing, only with the "residual demand" i.e. with solar & wind taken out of the data. This gets us the residual (blue line) LDC.
Note that there isn't a one-to-one relationship between black & blue lines on the horizontal axis. 3/×
Note that there isn't a one-to-one relationship between black & blue lines on the horizontal axis. 3/×
@Steve_Pinel @simonahac @JimmyZ51174789 @skaye @jpsburke @timminchin @OpenNem @Banshee2030 @GlenneDrover I could plot such a one-to-one plot of total & residual curves, so that both would be from the same time period along the horizontal axis, but one of them would just be noise. Thus a bit pointless. 4/×
@Steve_Pinel @simonahac @JimmyZ51174789 @skaye @jpsburke @timminchin @OpenNem @Banshee2030 @GlenneDrover But in the form I've presented the area between the curves (& above the x-axis) is the renewable share *within* South Australia. 50.1% for the first 5 months of 2019.
Clearly once that blue line goes negative, this is being exported into Victoria. 5/×
Clearly once that blue line goes negative, this is being exported into Victoria. 5/×
@Steve_Pinel @simonahac @JimmyZ51174789 @skaye @jpsburke @timminchin @OpenNem @Banshee2030 @GlenneDrover As a tangent off to deeper analysis on how load duration curves can be used to gain greater insight into managing & planing an electric grid, I *highly* recommend this vid in David's tweet.
And the discussion that follows ain't half bad either. 6/×
And the discussion that follows ain't half bad either. 6/×
@Steve_Pinel @simonahac @JimmyZ51174789 @skaye @jpsburke @timminchin @OpenNem @Banshee2030 @GlenneDrover A critical thing to note about the area (shaded in blue lines) between the total & residual curves is that it tightens at high demand levels, while thickens at low demand. This is a problem. But clearly demonstrates the feast or famine nature of high VRE. More in that vid👆 7/×
@Steve_Pinel @simonahac @JimmyZ51174789 @skaye @jpsburke @timminchin @OpenNem @Banshee2030 @GlenneDrover The final bit is the red "adjusted" line. That's something of my own concoction.
Since that fateful System Black back in 2016, it has been a requirement to make sure a minimum level of gas plants are online 24/7. Logically, even when exports are non-zero, this is local use. 8/×
Since that fateful System Black back in 2016, it has been a requirement to make sure a minimum level of gas plants are online 24/7. Logically, even when exports are non-zero, this is local use. 8/×
@Steve_Pinel @simonahac @JimmyZ51174789 @skaye @jpsburke @timminchin @OpenNem @Banshee2030 @GlenneDrover So by making a reasonable allocation of this required gas being used in South Australia, & excess renewables being exported to Victoria, I recalculate a new residual demand curve (red line) -> You can see a reduced SA share of renewables at 41% in this case (red shaded area). 9/×
@Steve_Pinel @simonahac @JimmyZ51174789 @skaye @jpsburke @timminchin @OpenNem @Banshee2030 @GlenneDrover *vertical, god damnit 😳
@Steve_Pinel @simonahac @JimmyZ51174789 @skaye @jpsburke @timminchin @OpenNem @Banshee2030 @GlenneDrover One more tweet will follow, that'll link to another thread on the financial side. It gets a bit involved, but not to hard to follow (I hope), so it deserves its own thread. 10/11
@Steve_Pinel @simonahac @JimmyZ51174789 @skaye @jpsburke @timminchin @OpenNem @Banshee2030 @GlenneDrover So here's the bit I mentioned earlier, related, but more for those of us who *really* obsess about this kind of thing. 11/11