Gavin Schmidt Profile picture
Climate scientist, occasional juggler, even more occasional author, curious about how the world works. "A despicable cad" - Anthony Watts
@AlgoCompSynth@universeodon.com by znmeb Profile picture davehuntsman Profile picture Dominik Lenné Profile picture Nancy LaPlaca Profile picture 6 subscribed
Oct 1, 2023 6 tweets 2 min read
Puzzled about what's happening in the Southern Oceans and with Antarctic sea ice?

You are not alone! Line graph of Antarctic sea ice area anomalies from 1979, showing a noisy but clear increase to a record high in 2014, and a rapid decline in 2016 to record low values in 2022 (and 2023). People have noticed an offset in the regional patterns seen in the CMIP6 ensemble and the observed trends in three main areas: the Eastern tropical Pacific (which has cooled slightly), the northern Atlantic Ocean (which has warmed a lot), and the S. Oceans which have cooled. Sea surface temperature trend map for 1990-2019 in the ERSST5 observations and a screened multi-model mean from 21 CMIP6 models.
Jul 4, 2023 5 tweets 2 min read
I can't help myself, climate deniers are too dumb. part 374:

The response to @billmckibben's tweet about sea ice anomalies in Antarctica is whatever the opposite of a chef's kiss is. [The waiter's fart?] First, Anthony got a bit confused a pulled out an ice sheet mass loss meme instead of a sea ice one (and yes, they are different things - sea ice forms on the ocean surface, while ice sheets form from snow fall on land). Never mind though, double down on that when called on it!
Jun 19, 2023 12 tweets 3 min read
I have thoughts about scientists ‘debating’ contrarians, conspiracists and assorted bad faith actors (or authors).

For reference, I speak w/25 years experience of being a ‘public’ climate scientist… Over that time I’ve appeared on multiple platforms (TV in studio/remote, radio, stage, panels, etc), with almost every high profile sceptic or do-nothing-er you can name.

These interactions have ranged from the incomprehensible (literally ppl talking over you the whole time)…
Jun 17, 2023 7 tweets 2 min read
Every so often someone will post a link to an anonymous website that purports to show recent global temperatures. It doesn’t. Screenshot of a website sho... This data doesn’t look any other data set - either from weather stations, reanalyses, satellites, radiosondes, or argo floats, etc. Multiple kinds of data sets...
Jun 17, 2023 4 tweets 3 min read
Also new from @NASAGoddard SVS, a rather disorientating video exploring different map projections of the globe:

Disappointed that they don't have my go-to projection for global maps, the Equal Earth projection (similar to Robinson, but equal area): Equal Earth projection dist...
May 31, 2023 8 tweets 3 min read
#Elniño is trending for obvious reasons, but let me inject a note of caution... SST anomaly map from Climat... The conventional wisdom pays attention to the ENSO forecasts collated at IRI, which come in two flavors, dynamical and statistical. iri.columbia.edu/our-expertise/… IRI collation of ENSO forec...
May 14, 2023 32 tweets 8 min read
A quick 🧵 on Lomborg etc.

I was once asked by someone prominent in the tech/internet area whether there was anything to the his critiques of climate change mitigation. I said no, but I could tell he really wanted me to say yes. Lomborg's shtick is definitely appealing. But why? The release of Lomborg's 'new' book (which appears to be the same as all his previous books) is a reasonable point to dive in: screen grab of a Bjorn Lomb...
Jul 11, 2022 8 tweets 3 min read
One of the most-read posts at @RealClimate is a description of the CO2 problem in six easy steps from 2007. In the subsequent fifteen years, there's more data, evolution of some details and concepts and better graphics. So time for an update!
realclimate.org/index.php/arch… Step 1: There is a natural greenhouse effect.

Roughly 158 W/m2 of longwave energy emitted from the surface of the Earth is absorbed in the atmosphere. Energy flows in the Earth's atmosphere
Jul 1, 2022 8 tweets 3 min read
This claim that ‘IPCC needs 30 yrs to detect changes’ is nonsense. Conceivably someone said it(?) but basically all detection work relies on single to noise ratios which, depending on the variable & size of the signal,can lead to detection over much shorter or much longer periods For instance, we can statistically detect the impact of a big volcanic eruption in stratospheric temperatures in months! But we can only detect the influence of orbital forcing over millennia.
Jun 30, 2022 9 tweets 4 min read
There is a lot in this decision, but it isn’t the dismantling of the administrative state, or the curtailment of the EPA that some folks were predicting. Nor does it prevent federal action to curtail GHGs. As @amywestervelt has been saying, the fact that this case was taken despite the original clean power plan was never put into effect (implying that no one can show standing for any harms done by it), and it’s goals having been achieved in any case, makes the whole thing odd.
Jun 9, 2022 9 tweets 3 min read
This story is a little nuts and a great example of how Earth data collation is a very human (and therefore potentially flawed) endeavor. Wind speeds at weather stations are encoded using direction and speed and character. For calm days, the character is ‘C’, wind direction is undefined, and speed is ~0. All these station data are collated in efforts like HadISD, from which regional/global assessments are made.
Jun 9, 2022 5 tweets 2 min read
I’m a bit slow to this, but this is a great example for how growth, climate, air quality, and urban design all intersect. The story provides Owens Lake as a cautionary tale, but perhaps the Aral Sea or Lake Chad are also relevant (but not so hopeful). nytimes.com/2022/06/07/cli… These satellite photos make the change very clear (via @PeterWSinclair) Great salt lake in 1987 and...
Apr 20, 2022 4 tweets 2 min read
Just listened to a BBC radio play about Ben Santer, his life & some of the shenanigans associated with the 1995 @IPCC_CH report’s conclusion that there was a ‘discernible’ human influence on climate. bbc.co.uk/sounds/play/m0… A few of the usual suspects feature (Singer, Seitz, Rohrabacher, Pearlman, the WSJ oped page), but the most interesting part is the weaving of events from the rest of Ben’s life - climbing accidents, his failing marriage, jury duty - as the background.
Apr 14, 2022 14 tweets 6 min read
This is flat out 💩 from Epstein. Misreading of vague quotes instead of actually looking at the scientific papers that have all the information. Turns out that Hansen (et al!)'s projections bracketed what happened.
Mini 🧵... We actually know exactly what went into Hansen's models, and we know exactly what came out (and no, it wasn't garbage). This was in 1988 and it was the first time that anyone had used one of the those new-fangled climate models for a transient projection. Image
Mar 28, 2022 4 tweets 2 min read
Some odd results in replicating latest Scafetta effort. I added the uncertainty on the observational temperature difference, and included all ensemble members for which I have an ECS (everyone except FIO-ESM-2). @micefearboggis @GarethSJones1 #CMIP6 Figure 1 from Scafetta (2022) showing model trends compared CMIP6 model trends as a function of ECS compared to ERA5 (pl Note that there are many ensemble members that have temperature differences smaller than the ERA5 value with ECS > 3. None of which appear in Scafetta's figure.🧐🧐🧐

Possibly just a function of the automatic ensemble member selection when downloading from ClimExp?
Feb 19, 2022 7 tweets 3 min read
@AndrewDessler makes a excellent point here.

Similarly, I was discussing batteries with a physics professor last week, and he insisted that there has been effectively no progress in large scale storage. But actually there has. First off, prices for Li-ion batteries have decreased by a factor of 25(!) since the 1990s. Price per kWh for Li-ion batteries showing declines from 199
Feb 19, 2022 9 tweets 4 min read
It's quite telling that the some folk think the antidote to understanding the climate crisis is cherry picking and tortured logic. This particular episode revolves around the Greenland Ice Sheet which has been losing roughly 275 Gt/yr of ice for the last 20 years.
climate.nasa.gov/vital-signs/ic…
Jan 19, 2022 12 tweets 4 min read
We see this with all of the anti-science bad faith arguments. Regardless of how often people have pointed out how silly it is, or that it makes no logical sense, or that there would be no motive to doing something like that, the smugs will continue to make it. The ingredients are simple. A name, an unexamined difference, an imputation of misconduct. Because remember, it's not enough to just argue about what should be done, the problem itself must not exist, or is being hyped by (((folks))). The 2-minute hate needs to be personalized.
Jun 25, 2021 11 tweets 2 min read
The potentially record-shattering extreme heat weather forecasts for the Pacific NW are pretty shocking, but some folks keep getting the climate change connection wrong. This guy for instance: cliffmass.blogspot.com/2021/06/incred…
May 27, 2021 5 tweets 2 min read
You know how some folk like to use a graph with the GEOCARB model estimates of CO2 over the last 500 million years and a hand drawn estimate of temperature to claim that CO2 doesn’t influence climate? Yes, that’s the one:
May 1, 2021 6 tweets 2 min read
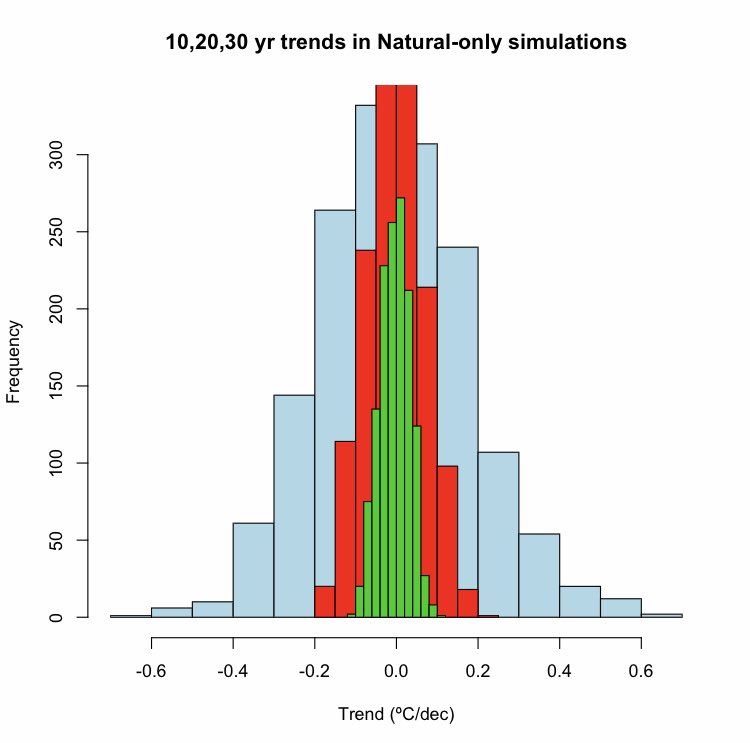
People have been making the (valid) point that climate variability still exists even after we reach net-zero carbon emissions. This can also be turned around: how close to net-zero do you need to get to no longer be able to detect temperature trends? An estimate of natural variability at different periods can be derived from natural-forcing-only historical runs (includes volcanoes/solar etc). The 95% confidence intervals on the spread is 0.35, 0.14, 0.07°C/dec for 10, 20 & 30 yr trends respectively. Histogram of trends over 10, 20 or 30 years GISS ModelE2.1-G