Discover and read the best of Twitter Threads about #TorRE
Most recents (9)

In your area, are there arguments between landlords and tenants? That certainly seems like the case in Canada's most expensive cities.
But in interviews, @_jennamoon and I found out that #COVID19 economic stress has got both sides agreeing on something. thestar.com/news/canada/20…
But in interviews, @_jennamoon and I found out that #COVID19 economic stress has got both sides agreeing on something. thestar.com/news/canada/20…
In interviews with @TorontoStar, landlords and tenants say they have felt unfairly judged and stereotyped.
However, both landlord and tenants have, in this rare moment, also found something they can agree on: The system is broken on both sides. thestar.com/news/canada/20… #COVID19
However, both landlord and tenants have, in this rare moment, also found something they can agree on: The system is broken on both sides. thestar.com/news/canada/20… #COVID19
This is Jason Boyes. He works as an industrial mechanic and was able to buy a home in Kamloops in rural B.C.. But living in Vancouver, the most reasonable rent his family could find for a two-bedroom was $2,295/month. 


December #Toronto #realestate market charts are up! Month and year-end highlights in this blog post. As always, a few bonus charts in this thread. #TorRE /1
areacode416homes.com/december-2019-…
areacode416homes.com/december-2019-…
One of the things I manually track to see if things are heating/cooling is the percent of sales that sold for over asking (SOA). Here you can see that 416 Freeholds spent the last 9 months higher than they were last year. The 9% spread in December was the highest all year. /2

416 Condos spent the last 5 months hotter than 2018, and Dec was tied with Dec 2016 as highest ever for that month. Similarly, Dec gap of 10% higher than last year was largest gap of the year. /3

RBC's monthly Focus on Housing report is out now. Remember all of those "Toronto is just following Vancouver by 6 (or whatever) months" theorists? Well either they were wrong, or Toronto's been doing it wrong for about a year now. #VanRE #TorRE /1

And since 2000 Toronto has only had one buyer's market period, while Vancouver has had 3. They're just different markets with their own unique forces. (Note "new listings" are a flawed stat with TREB so SNLR isn't my favourite stat, but point is the same.) /2


Their 2019 summary on Vancouver and Toronto:
- increasing evidence buyers have adjusted to earlier policy changes
- modest declines in mortgage rates also helped spur demand
- biggest issue now is low inventories /3
- increasing evidence buyers have adjusted to earlier policy changes
- modest declines in mortgage rates also helped spur demand
- biggest issue now is low inventories /3
RBC's Monthly Housing Update for December was just released. Here are a few Toronto related (really GTA) things. SUPPLY was mentioned a lot in the report (being low). That contributed to HPI being highest YoY increase since 2017 when was coming down off a high. #TorRE /1

Toronto in "Seller's Market" territory in Sales to New Listings Ratio (40-60% considered "Balanced"), just ahead of nat'l average. Montreal "hottest" in this stat. This stat is a bit garbage in Toronto because TREB's count of new listings is inflated (so ratio underinflated). /2

Mentions "November brought further evidence that supply—more specifically, the lack thereof—is becoming the main housing story in Canada." Cites CREA showing national MOI lowest in more than 12 years. /3
Weekly live look-in at 416 active listings. Condos have been lower than last year since July, while freeholds started diverging in late Sept. Difference from this week last year:
Condos ⬇️423 (-18%)
Freehold ⬇️455 (-21%)
#TorRE /1
Condos ⬇️423 (-18%)
Freehold ⬇️455 (-21%)
#TorRE /1

As fewer and fewer fresh listings come out as we wind down for the holidays, the share of freeholds that have been on the market 30+ days has climbed to 65%, same as last year this time. Peak was Jan 1 with 78% 30+ DOM (days on market). /2

Condo activity slows down too, but it's not quite so seasonal as houses (in a building, and less families I hypothesize), and share of 30+ DOM is at 49% (close to 51% this time last year). /3

November Toronto Real Estate market analysis - complete! Some wacky stuff this month, as you can read in the blog post. But as always, some highlights here - and this month LOTS of bonus charts. #TorRE /1
areacode416homes.com/november-2019-…
areacode416homes.com/november-2019-…
One thing that's surprised me has been the rapid acceleration in price growth for 416 condo apts. Here are the YoY price increases reported in the last 3 months.
Sept: +3.3%
Oct: +9.6%
Nov: +10.9%
I was waiting on Nov to see if Oct was a fluke. Guess not. /2
Sept: +3.3%
Oct: +9.6%
Nov: +10.9%
I was waiting on Nov to see if Oct was a fluke. Guess not. /2
Looking at all housing types, the GTA just reached its highest price growth shown this year, at 7.1%. The first 8 months of the year were all below 4% for the total GTA number. /3

RBC just released its Focus On Canadian Housing with a look at October. As with my "first-look" late last night they found the standout item to be the drop in new listings. Here are a few of the RBC charts. SNLR at 2 and half year high of 66%. /1

Seasonally adjusted sales are out of the lows they were at in most of 2017 and through 2018. /2


When you just can't decide which pic to use in your #listingphotos. (Note they only used 11 total pics - check out next in thread for bonus pic.) #TorRE /1

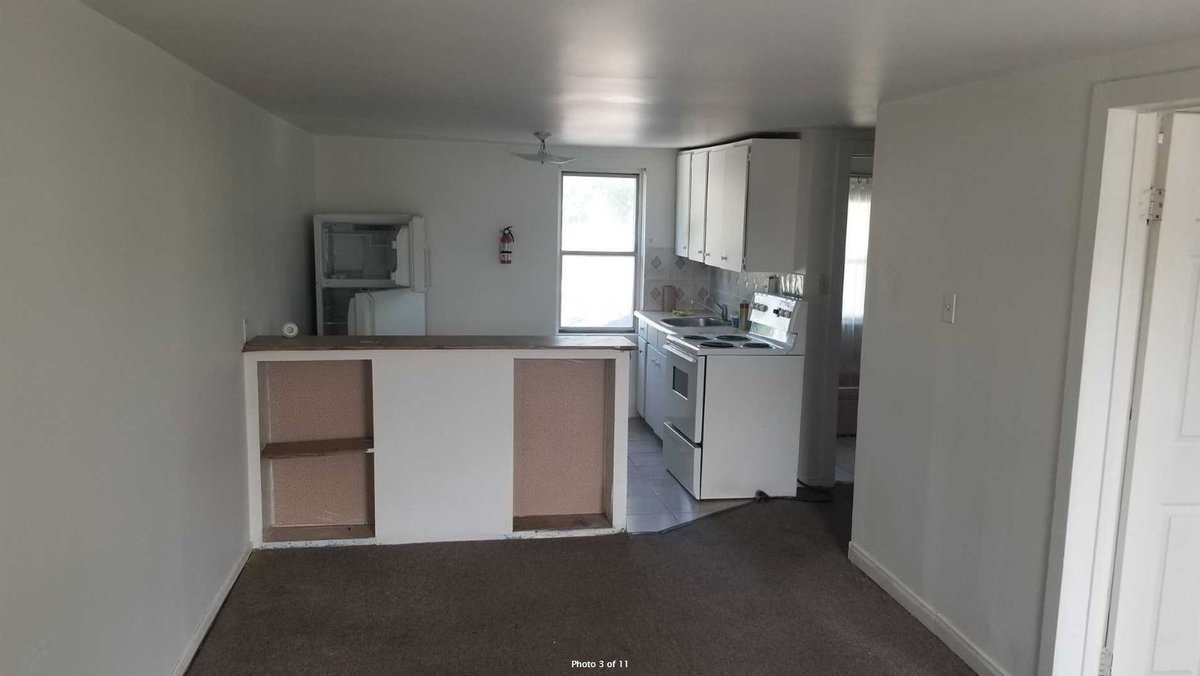


I can't even fathom the thought process when this agent was uploading these. Actually, I'll give you one more... /2
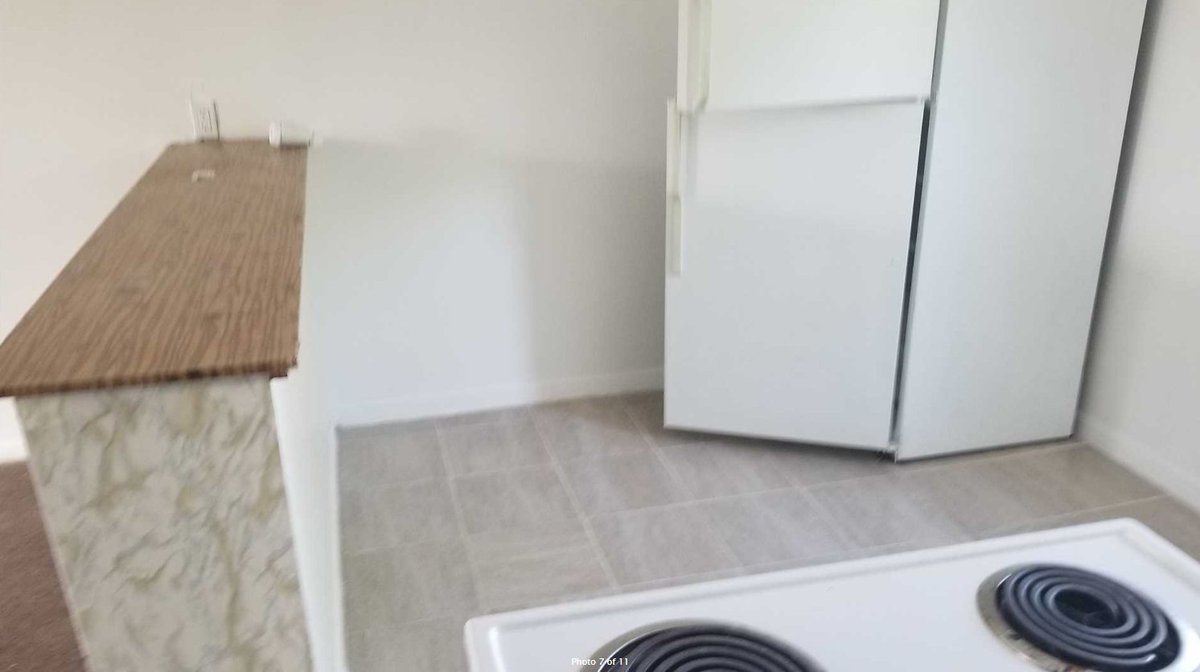
What is happening in this room, even? Bonus for close-up of grime on edge of door. One more from the agent's website... /3

416 Active listings check-in. As expected, fresh listings have bounced back after Labour Day (they get a little low at each stat holiday, then bounce back after). /1

Most pronounced in 416 Freeholds, ⬆️10.9% over last week, the largest jump since March 26. Note fresh listings (one week or less on market) have climbed from 17.6% to 32.1% of all listings. /2

416 Condos are ⬆️5.6% over last week. Though not as high as freeholds jump, is actually highest weekly % climb since Jan 22. Fresh rate jumped 9.3% to 28.9%. /3

