Discover and read the best of Twitter Threads about #bullishness
Most recents (18)

Analysis: #NASDAQ $BIOL
Case 561 #BIOLASE Inc.
DISCLAIMER: The analysis is strictly for educational purposes and should not be construed as an invitation to trade.
BIOL 1/3
Case 561 #BIOLASE Inc.
DISCLAIMER: The analysis is strictly for educational purposes and should not be construed as an invitation to trade.
BIOL 1/3

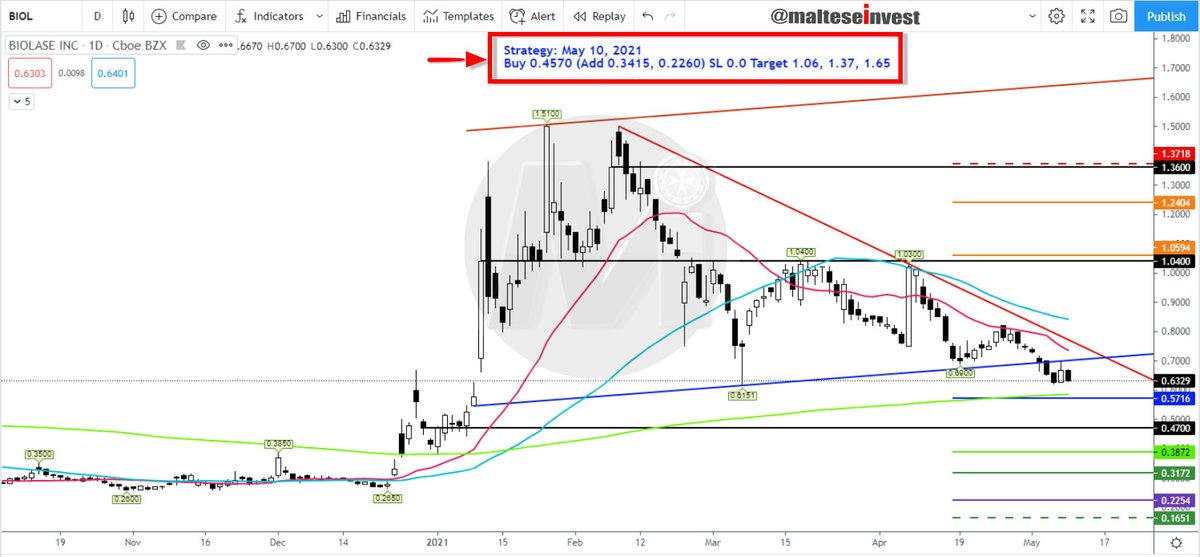
Daily Chart: Jan. 2021 #trendline support has yielded and is now heading for the #SMA 200 and 0.5716. Farther down the #pivot at 0.4700 then block #support 0.3872- 0.2254 with balance at 0.1651. Price needs to .....
BIOL 2/3
BIOL 2/3
..... close above control at 1.0594 for medium term #bullishness. Above 1.3718 quickly targets 1.65/70.
The #Strategy is printed on the image.
BIOL 3/3
The #Strategy is printed on the image.
BIOL 3/3
Analysis: #NASDAQ $ONTX
Case 550 #Onconova Therapeutics Inc.
DISCLAIMER: The analysis is strictly for educational purposes and should not be construed as an invitation to trade.
ONTX 1/3
Case 550 #Onconova Therapeutics Inc.
DISCLAIMER: The analysis is strictly for educational purposes and should not be construed as an invitation to trade.
ONTX 1/3

Daily Chart: Conditions are becoming more #bearish especially with a loss of 0.6622, below the #SMA 200 at 0.6593. Father down #pivot 0.6344 - a close below targets the buying interest zone 0.4422- 0.2900. Notable #resistance begins at .....
ONTX 2/3
ONTX 2/3
..... the broken #trendline, now resistance at 0.9497 with SMA 50 at 1.0930. Long term #bullishness can only be achieved on a close/hold above control at 1.6400.
The #Strategy is printed on the image.
ONTX 3/3
The #Strategy is printed on the image.
ONTX 3/3

Analysis: #NYSE $ASXC
Case 546 #Asensus Surgical Inc.
DISCLAIMER: The analysis is strictly for educational purposes and should not be construed as an invitation to trade.
ASXC 1/3
Case 546 #Asensus Surgical Inc.
DISCLAIMER: The analysis is strictly for educational purposes and should not be construed as an invitation to trade.
ASXC 1/3
Daily Chart: The outlook has turned very #bearish with the loss of the SMA 50 and #pivot 2.86 supports. The current target is 2.25 with a close below eying 1.89 then control at 1.56 and #SMA 200 at 1.47. Farther down ......
ASXC 2/3
ASXC 2/3
..... strong #support 1.20- 0.87. Immediate #resistance 3.40/71 then 5.06 but medium term #bullishness can only be achieved above the synthetic at 5.48.
The #Strategy is printed on the image.
ASXC 3/3
The #Strategy is printed on the image.
ASXC 3/3

Analysis: #NYSE $GSAT
Case 543 #Globalstar Inc.
DISCLAIMER: The analysis is strictly for educational purposes and should not be construed as an invitation to trade.
GSAT 1/3
Case 543 #Globalstar Inc.
DISCLAIMER: The analysis is strictly for educational purposes and should not be construed as an invitation to trade.
GSAT 1/3

Daily Chart: The #parabolic move seen in Feb. 2021 has made conditions messy - the correction hasn't ended and price is contained below the #SMA 20 and 50. The current target is the #pivot 1.02 with spikes down towards 0.92. Strong .....
GSAT 2/3
GSAT 2/3
..... #support 0.73/51 with the SMA 200 in between. Immediate #resistance is 1.48/56. Medium term #bullishness can only be achieved on a close above 3.53. Use price flexibility upon entering the trade.
The #Strategy is printed on the image.
GSAT 3/3
The #Strategy is printed on the image.
GSAT 3/3

Analysis: #NASDAQ $RKDA
Case 536 #ArcadiaBiosciences, Inc.
DISCLAIMER: The analysis is strictly for educational purposes and should not be construed as an invitation to trade.
RKDA 1/3
Case 536 #ArcadiaBiosciences, Inc.
DISCLAIMER: The analysis is strictly for educational purposes and should not be construed as an invitation to trade.
RKDA 1/3

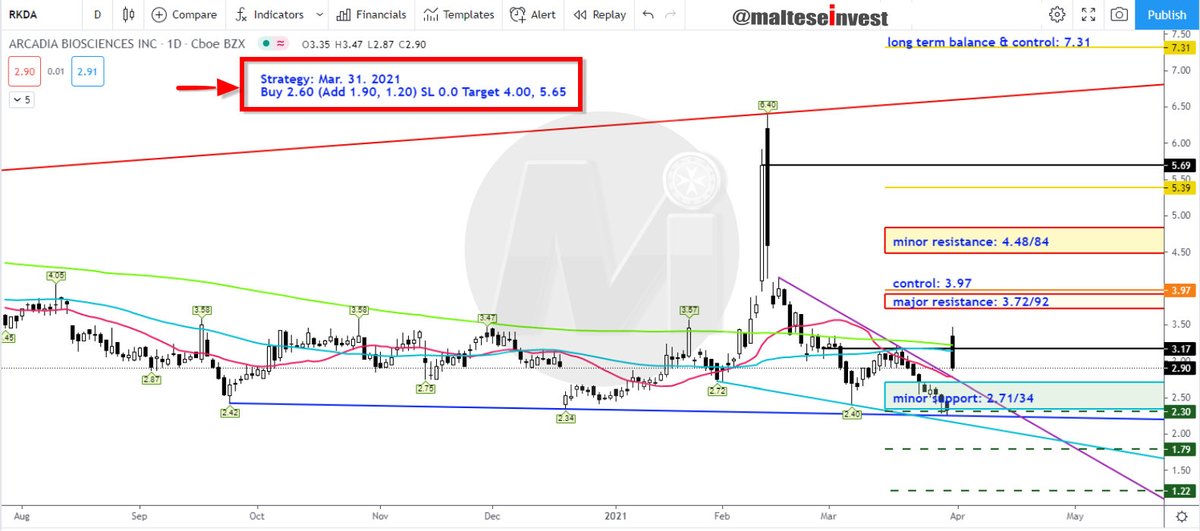
Daily Chart: Gapped up and down again, holding below the #SMA 200 and #pivot (3.22/17 respectively). Above major #resistance 3.72/92 with control at 3.97. Medium term #bullishness on a .....
RKDA 2/3
RKDA 2/3
..... daily close above 7.31. #Support begins at 2.71/34 then the #trendline 2.13, farther down buying interest 1.79/22.
The #Strategy is printed on the image.
RKDA 3/3
The #Strategy is printed on the image.
RKDA 3/3
Analysis: #NASDAQ $NNDM
Case 531 #NanoDimension Ltd.
DISCLAIMER: The analysis is strictly for educational purposes and should not be construed as an invitation to trade.
NNDM 1/3
Case 531 #NanoDimension Ltd.
DISCLAIMER: The analysis is strictly for educational purposes and should not be construed as an invitation to trade.
NNDM 1/3

Daily Chart: Expecting another leg lower towards the #trendline and control around 6.87. Decent #support seen at the #SMA 200 and #pivot 5.86. To the upside, mild #resistance at the Feb. 2021 trendline at 9.67, medium term #bullishness .....
NNDM 2/3
NNDM 2/3
..... will be achieved on a close above 12.96 which would then target 17.74.
The #Strategy is printed on the image.
NNDM 3/3
The #Strategy is printed on the image.
NNDM 3/3

Analysis: #NYSE $QS
Case 530 #QuantumScape Corporation
DISCLAIMER: The analysis is strictly for educational purposes and should not be construed as an invitation to trade.
QS 1/3
Case 530 #QuantumScape Corporation
DISCLAIMER: The analysis is strictly for educational purposes and should not be construed as an invitation to trade.
QS 1/3

Daily Chart: Heavily #bearish targeting 38.52- 35.42 a close below the latter eyes the major #support zone 28.58- 19.72. Price needs to close above a minimum 53.02 to target 64.45- 66.12, farther up .....
QS 2/3
QS 2/3
..... balance at 70.35. Medium term #bullishness can only be achieved above synthetic #resistance currently sloping at 91.55.
The #Strategy is printed on the image.
QS 3/3
The #Strategy is printed on the image.
QS 3/3

Analysis: #NYSE $PLTR
Case 528 #Palantir Technologies Inc.
DISCLAIMER: The analysis is strictly for educational purposes and should not be construed as an invitation to trade.
PLTR 1/3
Case 528 #Palantir Technologies Inc.
DISCLAIMER: The analysis is strictly for educational purposes and should not be construed as an invitation to trade.
PLTR 1/3

Daily Chart: Grinding lower, heading towards block #support 21.30- 19.43 below control at 17.68. To remove the immediate #bearish outlook a close above 28.35 is required but stability can only be achieved on a close/hold above .....
PLTR 2/3
PLTR 2/3
..... control at 31.48. This will target 35.28/87 and farther up #trendline support turned #resistance around 37.02. Long term #bullishness above 39.18.
The #Strategy is printed on the image.
PLTR 3/3
The #Strategy is printed on the image.
PLTR 3/3

Analysis: #NYSE $SOS
Case 525 #SOS Limited
DISCLAIMER: The analysis is strictly for educational purposes and should not be construed as an invitation to trade.
SOS 1/3
Case 525 #SOS Limited
DISCLAIMER: The analysis is strictly for educational purposes and should not be construed as an invitation to trade.
SOS 1/3

Daily Chart: Price has corrected lower but we are doubtful it has ended. Strong #support is seen 3.82- 0.24. A foothold above 11.21 is required to target 15.10 then firm #resistance 18.46- 25.22. Long term .....
SOS 2/3
SOS 2/3
#bullishness will only be achieved on a close above control at 31.34.
The #Strategy is printed on the image.
SOS 3/3
The #Strategy is printed on the image.
SOS 3/3

Analysis: #NASDAQ $GLBS
Case 521 #Globus Maritime Limited
DISCLAIMER: The analysis is strictly for educational purposes and should not be construed as an invitation to trade.
GLBS 1/3
Case 521 #Globus Maritime Limited
DISCLAIMER: The analysis is strictly for educational purposes and should not be construed as an invitation to trade.
GLBS 1/3

Daily Chart: Price needs to close above a minimum of 8.14 and then take hold of 8.90 to prevent the possibility of registering new lows, possibly down to 4.33. Price would need to close above .....
GLBS 2/3
GLBS 2/3
..... the #SMA 200 currently at 21.85 then above 43.29 for long term #bullishness.
The #Strategy is printed on the image.
GLBS 3/3
The #Strategy is printed on the image.
GLBS 3/3

Analysis: #NASDAQ $ATRS
Case 450 #AntaresPharma Inc.
DISCLAIMER: The analysis is strictly for educational purposes and should not be construed as an invitation to trade.
#ATRS 1/4
Case 450 #AntaresPharma Inc.
DISCLAIMER: The analysis is strictly for educational purposes and should not be construed as an invitation to trade.
#ATRS 1/4
Chart 1
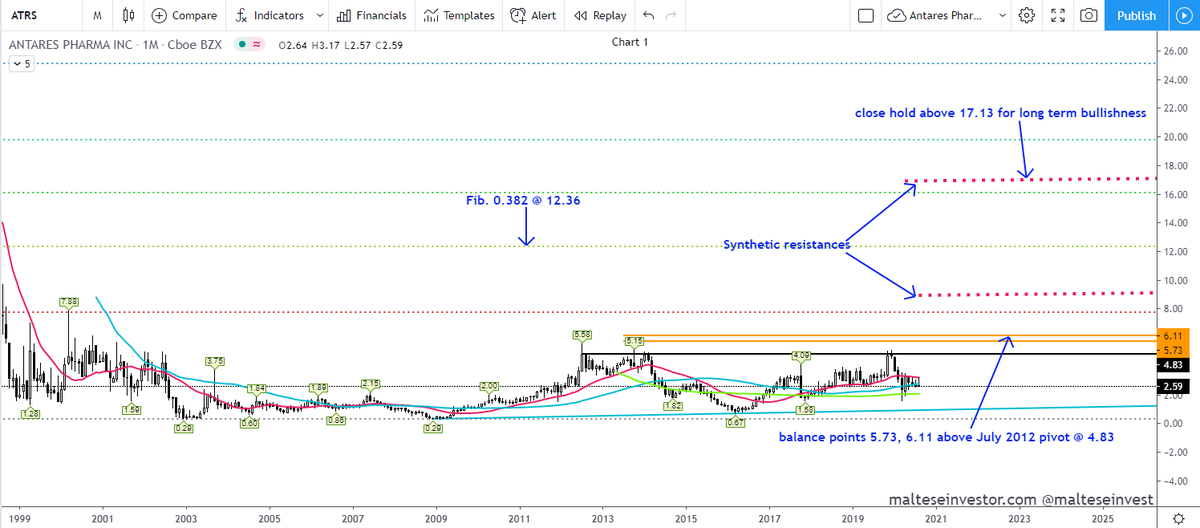
Monthly Chart: The 2012 range continues to dictate conditions. To get things going a minimum close/hold above the July 2012 #pivot at 5.58 is required, but this must be followed up with .....
ATRS 2/4
Monthly Chart: The 2012 range continues to dictate conditions. To get things going a minimum close/hold above the July 2012 #pivot at 5.58 is required, but this must be followed up with .....
ATRS 2/4
..... the close above 2 balance points at 5.73 and 6.11. Higher up #Fib. 0.236 at 7.74 then the synthetic #trendline at 8.97 and it is only above here that medium term #bullishness is achieved.
ATRS 3/4
ATRS 3/4
Analysis: #NASDAQ $AYTU
Case 438 #Aytu BioScience Inc.
DISCLAIMER: The analysis is strictly for educational purposes and should not be construed as an invitation to trade.
#AYTU 1/5
Case 438 #Aytu BioScience Inc.
DISCLAIMER: The analysis is strictly for educational purposes and should not be construed as an invitation to trade.
#AYTU 1/5

Chart 1
Daily Chart: The #parabolic move seen in Mar.2020 stalled exactly at the one year trendline #resistance and has since corrected lower to the #Fib. 0.786 at 0.90, the gap has been partially filled - off by 0.45. #Momentum is negative and beginning to .....
AYTU 2/5
Daily Chart: The #parabolic move seen in Mar.2020 stalled exactly at the one year trendline #resistance and has since corrected lower to the #Fib. 0.786 at 0.90, the gap has been partially filled - off by 0.45. #Momentum is negative and beginning to .....
AYTU 2/5
..... fall. The range is 2.17- 0.58, heavier at the top due to short term profit taking. Price needs to close above the Mar. 2020 #trendline with #SMA 50 riding it at 1.41, then hold above 1.72 to target 2.01/05 but #bullishness will only be achieved by the .....
AYTU 3/5
AYTU 3/5
Analysis: #NASDAQ $VXRT
Case 419 #Vaxart Inc.
DISCLAIMER: The analysis is strictly for educational purposes and should not be construed as an invitation to trade.
#VXRT 1/5
Case 419 #Vaxart Inc.
DISCLAIMER: The analysis is strictly for educational purposes and should not be construed as an invitation to trade.
#VXRT 1/5

Chart 1
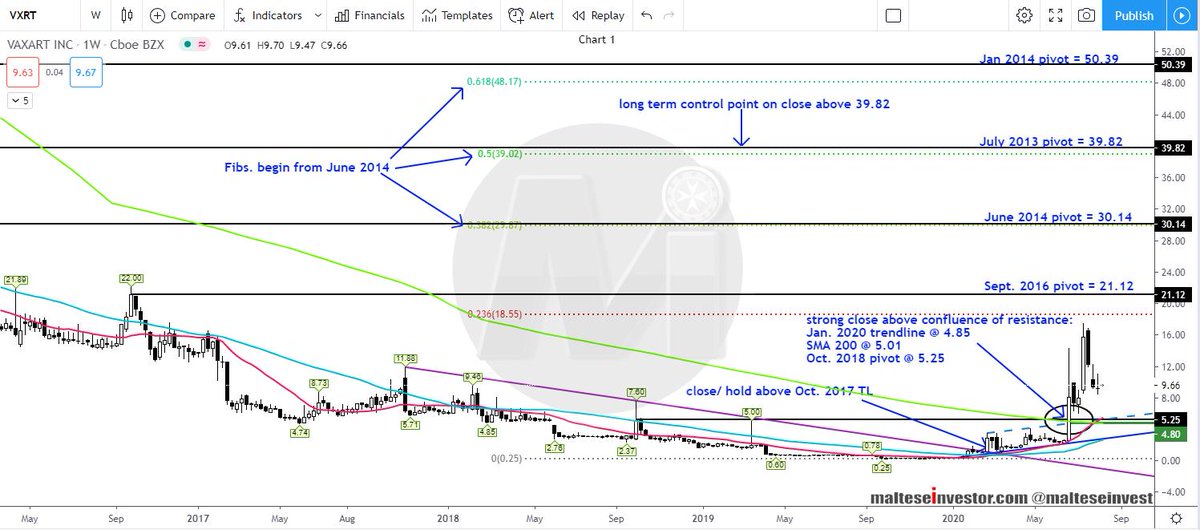
Weekly Chart: The all time low at 0.25 is confirmed following the strong close above Nov. 2017 trendline. June 2020 witnessed a strong close above a #confluence of #resistance - Jan. 2020 #trendline, SMA 200 and Oct. 2018 .....
VXRT 2/5
Weekly Chart: The all time low at 0.25 is confirmed following the strong close above Nov. 2017 trendline. June 2020 witnessed a strong close above a #confluence of #resistance - Jan. 2020 #trendline, SMA 200 and Oct. 2018 .....
VXRT 2/5
..... pivot respectively at 4.85, 5.01 and 5.25. Note that the last time price traded above the #SMA 200 was in 2011. A close above the Sept. 2016 #pivot is now required for 30.14 and then above the control point 39.82 for long term #bullishness.
VXRT 3/5
VXRT 3/5
Analysis: #NASDAQ $NOVN
Case 401 #Novan Inc.
DISCLAIMER: The analysis is strictly for educational purposes and should not be construed as an invitation to trade.
#NOVN 1/4
Case 401 #Novan Inc.
DISCLAIMER: The analysis is strictly for educational purposes and should not be construed as an invitation to trade.
#NOVN 1/4

Chart 1
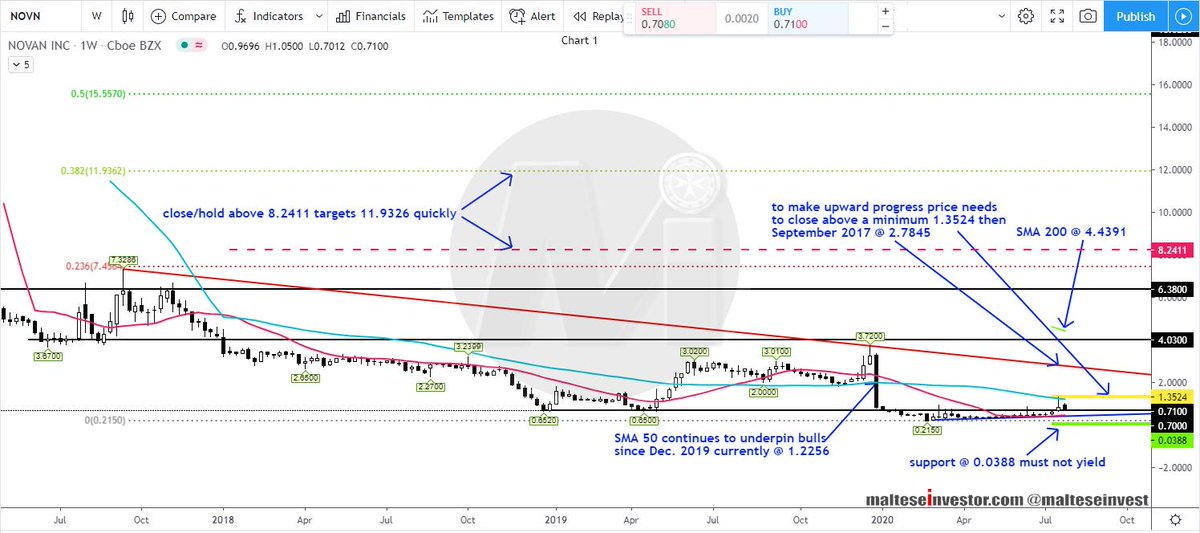
Weekly Chart: The #SMA 50 at 1.2256 continues to underpin upside probes but price needs to first close above synthetic #resistance at 1.3524 then the Sept. 2017 trendline at 2.7845 for #bullishness. Price is currently .....
NOVN 2/4
Weekly Chart: The #SMA 50 at 1.2256 continues to underpin upside probes but price needs to first close above synthetic #resistance at 1.3524 then the Sept. 2017 trendline at 2.7845 for #bullishness. Price is currently .....
NOVN 2/4
..... targeting Dec. 2018 #pivot at 0.7000 below that SMA 20 at 0.4732, then Mar. 2020 #trendline at 0.4112. A loss of 0.3888 will be disastrous as it's the last level of #support.
NOVN 3/4
NOVN 3/4
Analysis: #NASDAQ $KNDI
Case 375 #Kandi_Technologies Group Inc.
DISCLAIMER: The analysis is strictly for educational purposes and should not be construed as an invitation to trade.
#KNDI 1/4
Case 375 #Kandi_Technologies Group Inc.
DISCLAIMER: The analysis is strictly for educational purposes and should not be construed as an invitation to trade.
#KNDI 1/4

Chart 1
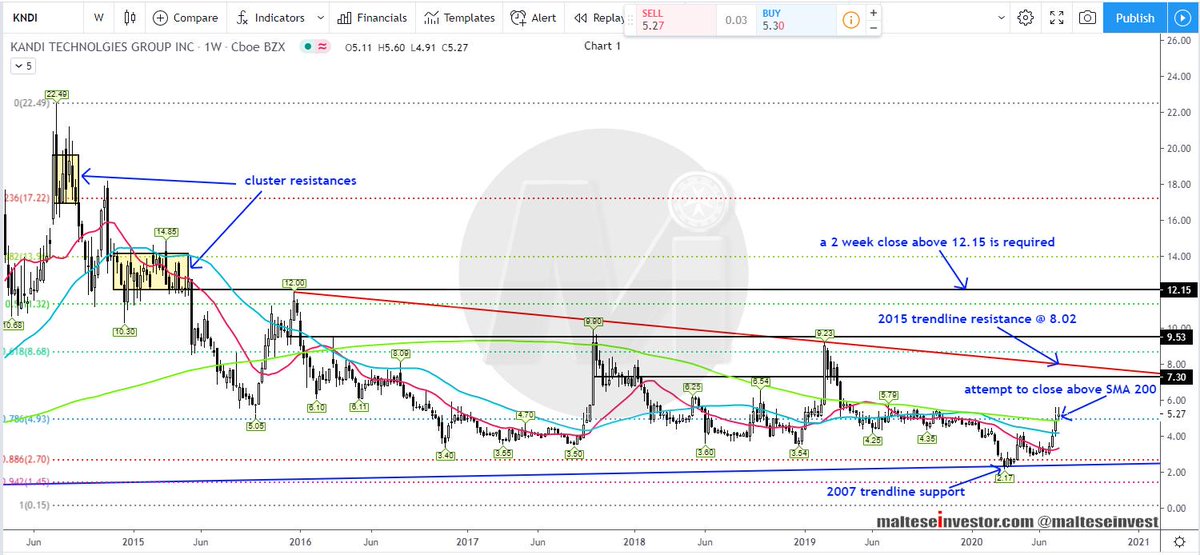
Weekly Chart: The Mar. 2020 low found #support at the 2007 #trendline and has bounced and is attempting to close above the SMA 200 4.87. Conditions are messy and a little overstretched with immediate .....
KNDI 2/4
Weekly Chart: The Mar. 2020 low found #support at the 2007 #trendline and has bounced and is attempting to close above the SMA 200 4.87. Conditions are messy and a little overstretched with immediate .....
KNDI 2/4
..... #resistance at 8.02 (2015 trendline). Further up #pivot resistance at 9.53 - a 2 week close above #cluster base at 12.15 is required for long term #bullishness.
KNDI 3/4
KNDI 3/4
Analysis: #NASDAQ $HEAR
Case 336 #Turtle_Beach Corporation
DISCLAIMER: The analysis is strictly for educational purposes and should not be construed as an invitation to trade.
#HEAR 1/4
Case 336 #Turtle_Beach Corporation
DISCLAIMER: The analysis is strictly for educational purposes and should not be construed as an invitation to trade.
#HEAR 1/4

Chart 1
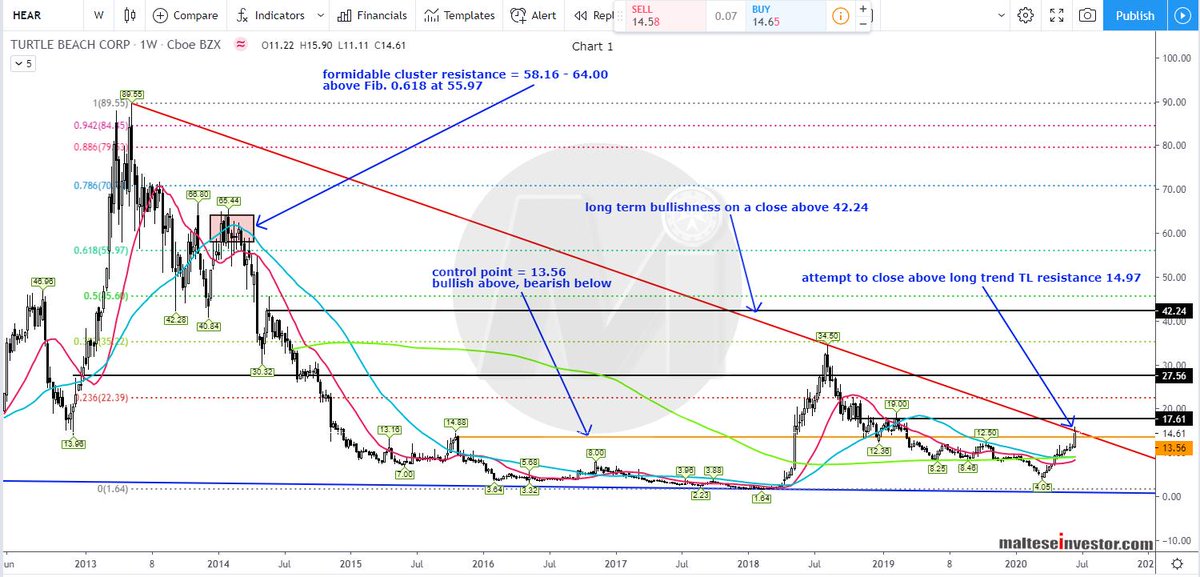
Weekly Chart: Price has risen strongly above the control point at 13.56 and is currently attempting to break/close above long term #trendline resistance at 14.97. Mild cluster #resistance is seen at 17.61 - a close above targets 27.56. To .....
HEAR 2/4
Weekly Chart: Price has risen strongly above the control point at 13.56 and is currently attempting to break/close above long term #trendline resistance at 14.97. Mild cluster #resistance is seen at 17.61 - a close above targets 27.56. To .....
HEAR 2/4
..... achieve long term #bullishness price needs to close above 6 year #pivot resistance at 42.24 which will target the cluster base at 58.16 sitting atop #Fib. 0.618.
HEAR 3/4
HEAR 3/4
Analysis: #NYSE $SHOP
Case 334 #Shopify Inc. - Revisited
DISCLAIMER: The analysis is strictly for educational purposes and should not be construed as an invitation to trade.
#SHOP 1/4
Case 334 #Shopify Inc. - Revisited
DISCLAIMER: The analysis is strictly for educational purposes and should not be construed as an invitation to trade.
#SHOP 1/4

Chart 1
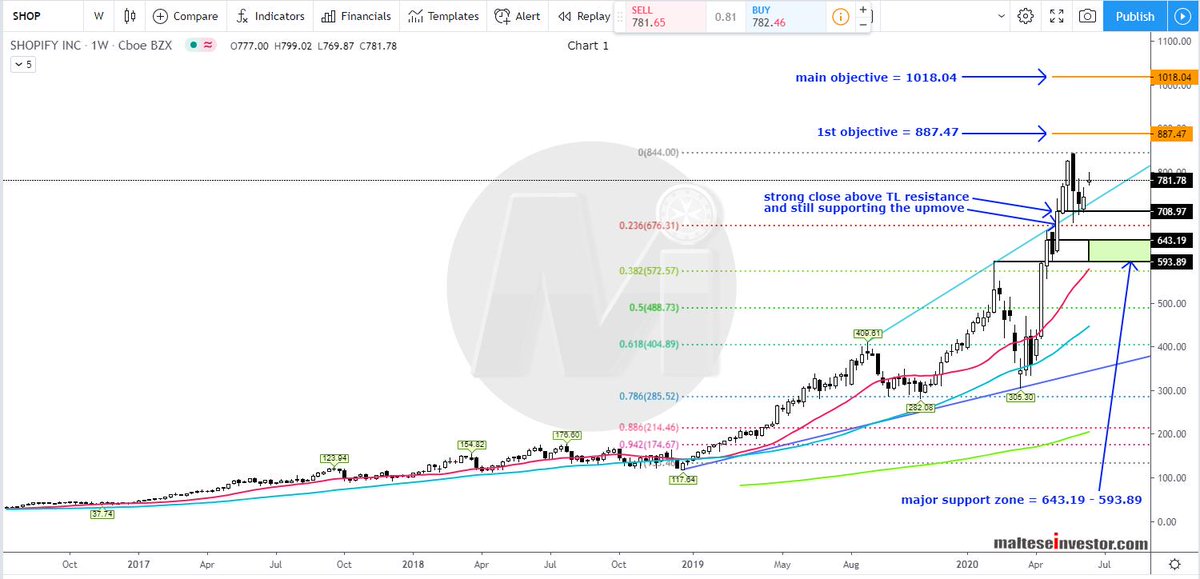
Weekly Chart: The strong close above #trendline #resistance seen in May 2020 continues to support the current upmove. The first objective is 887.47 and a close above will target 1018/20. To maintain .....
SHOP 2/4
Weekly Chart: The strong close above #trendline #resistance seen in May 2020 continues to support the current upmove. The first objective is 887.47 and a close above will target 1018/20. To maintain .....
SHOP 2/4
..... #bullishness the price needs to hold above 708.97 - a close below targets major #support between 643.19 - 593.89.
SHOP 3/4
SHOP 3/4
Analysis: #NASDAQ $NKLA
Case 333 #Nikola Corporation
DISCLAIMER: The analysis is strictly for educational purposes and should not be construed as an invitation to trade.
#NKLA 1/4
Case 333 #Nikola Corporation
DISCLAIMER: The analysis is strictly for educational purposes and should not be construed as an invitation to trade.
#NKLA 1/4

Chart 1
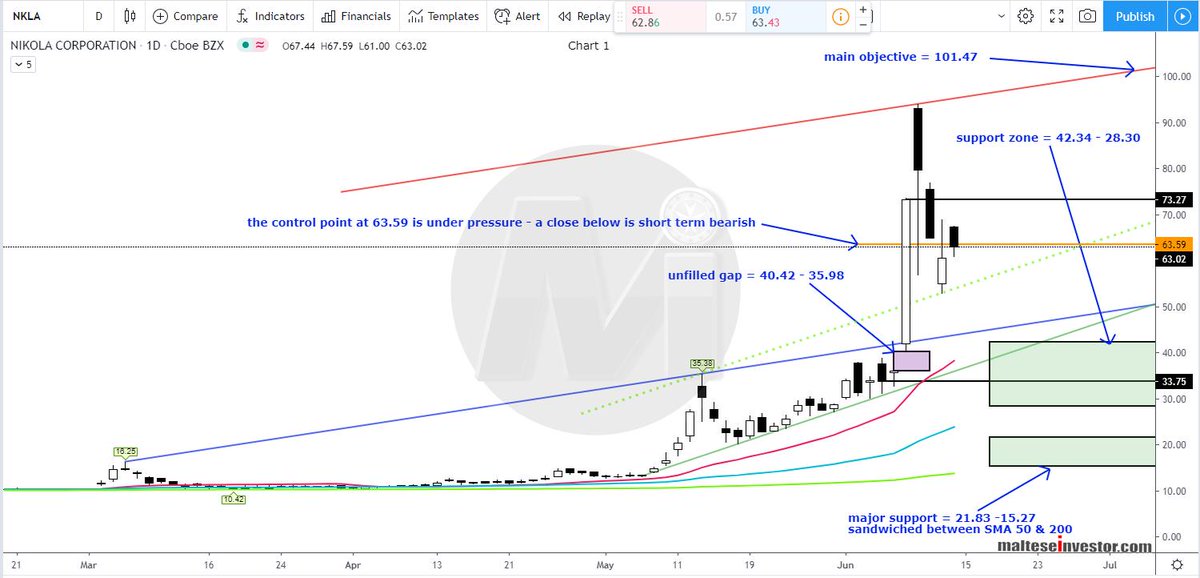
Daily Chart: The July blowout reached an all time high of 93.99 and since then half of the gains have been wiped out. To maintain #bullishness the control point at 63.59 needs to hold then close above #pivot #resistance at 73.27 to .....
NKLA 2/4
Daily Chart: The July blowout reached an all time high of 93.99 and since then half of the gains have been wiped out. To maintain #bullishness the control point at 63.59 needs to hold then close above #pivot #resistance at 73.27 to .....
NKLA 2/4
..... target 100.23 - 101.47 in the long term. To the downside an unfilled gap of 40.42-35.98 exists. The immediate support zone (below the broken #trendline) is 42.34 - 28.30 and further down major #support, sandwiched between #SMA 50 and 200 is 21.83 - 15.57.
NKLA 3/4
NKLA 3/4