Jim Bianco Profile picture
Macro investment research at https://t.co/hQqAza8GGP Our total return index is at https://t.co/vta9eqevnU The ETF WTBN tracks our Index. biancoresearch.eth
stewart sprague Profile picture Not Fred Goodwin Profile picture Jessymogan Profile picture pnwarrior_womyn Profile picture Paul Profile picture 122 subscribed
May 8 9 tweets 3 min read
1/9

I've been asked about my stance on yields. Do I still think the 10-year yield is going to 5.00%—5.50%?

Yes

But I also took a neutral stance a few weeks ago.

75% of the move is over.

🧵 2/9

Where did 5.00% - 5.50% come from.

The belief is that the 40-year bond bull market is over (in 2020), and a multi-year bond bear market is continuing.

So, 5.00% - 5.50% is a higher high than the 5% peak of last October, as would be expected in a bear market. Image
May 5 6 tweets 4 min read
1/6

A great piece by @EconTodd and James Carter about how the US Treasury messed up the last 15 years ago. (h/t @judyshel)
---
Rather than issuing 50- or 100-year bonds when interest rates were at rock-bottom, the US Treasury dismissed this option and simply continued to borrow on a short-term basis. Now that US interest payments are ballooning, the scale of this blunder has become apparent, as have the implications for future generations.

project-syndicate.org/commentary/sup… 2/6

This almost triggered me to read as I have been arguing the same thing.
---
April 29, 2012

“I don’t get why the Treasury thinks floaters are a good idea with short-term rates at zero percent, as they only have one way to go, and that’s up,” said James Bianco, president of Bianco Research LLC in Chicago in an interview on April 24.

“They should be lessening the cost of financing the United States government for the taxpayers,” Bianco said. “The Treasury should be issuing 100 year or perpetual bonds until the market can’t stand it anymore to lock in these rates.”

bloomberg.com/news/articles/…
May 1 6 tweets 3 min read
1/6

As this chart shows, the current BTC price is the average purchase price of the Spot BTC ETF buyers. ~$57K to ~$58K Image 2/6

So, about $37 billion in Spot BTC assets (x-GBTC) now have no profits and maybe a small loss. Image
Apr 28 11 tweets 5 min read
1/11

The more data we get, the more I worry about the risks involved with Spot ETF.

🧵to update
--
Investment Advisors hold about 35% of all ETFs. However, they hold less than 1% of the new Spot BTC ETF.

"Here come the boomers" was/is a myth.

2/11

Why does this matter?

It confirms my fear that the Spot BTC ETFs are effectively "orange FOMO poker chips" for paper-handed small-time traders (degens).

These degens are getting close to their breakeven, which could turn them in big-time sellers.

Let's dig in.
Apr 21 6 tweets 4 min read
1/6

The deficit as a % of GDP (bottom), now 5.93%, is higher than in any period except the Great Recession (2007 - 2009) and the 2020 COVID shutdown (dotted line).

The government is borrowing to spend money like the economy is trying to recover from a recession. Image 2/6

This separates Federal revenues (orange) and spending (blue).

The difference is the deficit (middle panel).

The bottom panel (black) shows that taxes only cover 73% of federal spending. The other 27% has to be borrowed. Image
Apr 19 7 tweets 3 min read
1/7

Happy Bitcoin halving day Degens!

A 🧵on

The flows peaked in a frenzy in Mid-March.

The 13Fs are a disappointment. Very little wealth manager adoption so far (like 1%).

Unrealized gains are shrinking fast.

Why I've been skeptical of Spot BTC ETFs. 2/7

* March 11 = only $1B inflow day.

* March 12 = Brokerage report saying $220B of inflows over the next 3 years (effectively predicting constant inflows, forever).

* March 13, all-time high close (5PM ET price)

Since the mid-March frenzy, inflows peaked (top panel). Image
Apr 16 15 tweets 4 min read
1/15

What's going on with the bond market?

It is not pretty.

And if the bond market is ugly, everyone else suffers.

🧵 2/15

First, let's remember how this year started.

On December 18, 2023, BofA published its December 2023 Global Fund Manager Survey.

This graphic shows that these managers were the most bullish on rates since they started asking the question 20 years ago (2003). Image
Apr 11 14 tweets 4 min read
1/13

The street has had a tough 24 hours.

Rallied bonds/stocks into CPI, thinking they would miss the consensus (below). Instead, they beat the consensus (above).

This morning, they sold off stocks/bonds into PPI, thinking they would beat. Instead, they missed.

🧵 2/13

We need to ask why getting a handle on inflation is so hard.

My take ....

* Inflation is incredibly hard to predict. It might be the hardest of all economic indicators.

* Everyone believes inflation is the easiest to predict.
Apr 5 9 tweets 4 min read
1/8

Late afternoon🧵on the bond market

1-Day tick chart of the 10-year yield

The 10-year yield sold off back to the day's high yield, closing at 4.40%.Image 2/8

The 10-year yield closed on the 50% retracement (cyan line, 4.40%), the highest since Nov 27.

Will it hold?

Ultimately, I don't think it does.

For months, I have been in the camp since the 10-year trades 5.00% (last year's high) to 5.50% later this year.

Still thereImage
Apr 4 5 tweets 2 min read
1/5

Payroll Report Preview 🧵

Economists’ median estimate for tomorrow’s payroll release is 215k. Estimates range from 150k to 250k.

Note that February was initially reported as 275k. So, every one of the 61 forecasts has payrolls declining from last month. Image 2/5

Since the beginning of 2022, economists have often underestimated the actual payroll release.

During these 26 months, economists underestimated payrolls 22 times. Image
Mar 30 10 tweets 4 min read
1/10

Grant Williams (@ttmygh) said we are a "Society of Speculators."

He is 100% correct, ir maybe more than 100%.

And if you understand this, many things start to make sense ... from TV viewership to markets.

🧵 2/10

Sports gambling is booming! And it is changing culture.

statista.com/chart/29332/gr…
Image
Mar 28 4 tweets 3 min read
1/4

Here are a couple of thoughts on tomorrow's PCE report (remember, there will be no market reaction as they are closed).

I will focus on what the Fed focuses on: Core PCE.

Below are the 57 economist forecasts, as surveyed by Bloomberg.

For the February Core PCE measure, the median estimate is 0.3%.
52 of the 57 are projecting 0.30%.
1 of 57 is projecting 0.4%
4 of 57 is projecting 0.2%

At his March 20 Presser, Powell said he expects 0.30%

Last Night, Governor Waller said in his speech that he also expects 0.3%.

So ... let's take a wild guess as to what everyone is looking for 🤔Image 2/4

PCE is compiled from the same survey of prices from which CPI and PPI are derived.

So, once these reports are released, it is an exercise to reweight them for core PCE. This produces a fairly accurate forecast.

For the February Core PCE report, this is 0.3%, with a few forecasts rounding to 0.2% or 0.4%.

Mar 19 4 tweets 2 min read
1/4

The national average of gasoline prices jumped again yesterday by over two cents to $3.49/gallon.

How it matters

short 🧵 Image 2/4

This caused the Cleveland Fed to raise its forecast for March CPI.

* March Monthly CPI is projected to rise 0.30% from 0.26% y'day.

* March Yearly CPI is now projected to rise by 3.37% from 3.34% y'day.

Gasoline prices are estimated to add 0.17% to March's monthly CPI. Image
Mar 16 7 tweets 3 min read
1/7

Below are the estimates for February PCE, which will be released at the end of the month.

This is the inflation metric the Fed uses. It will tell them that rate cuts are nowhere in sight right now.

🧵 2/7

Typically, these forecasts are accurate as PCE uses the same inputs as CPI and PPI; it is just an exercise of re-weighting them to PCE.

January was initially reported at 0.42% and is likely a little higher (0.5%) due to revisions in PPI components that feed into the PCE.
Mar 11 4 tweets 2 min read
1/4

February CPI out Tuesday (March 12) at 8:30 AM ET

Wall Street estimates that February will have a gain of 0.4%. Image 2/4

The chart below shows the monthly headline CPI (blue bars) and Wall Street’s estimate (orange line). The red/green bars on the bottom show the difference between the two.

The last time headline CPI came in below expectations on a month-over-month basis was in August. The last five months came in at or above expectations.Image
Mar 10 9 tweets 4 min read
1/9

This week's story might be Nvidia ($NVDA) and what happens after Friday's massive reversal. 

See the big red candle on Friday.

🧵 Image 2/9

Nvidia is the dominant driver of market returns this year. 

As this chart shows, it is roughly a third (blue) of the total change in the S&P 500's market cap (black line) this year. Image
Feb 28 4 tweets 3 min read
Following on @EricBalchunas comments ....

The orange line shows that all 10 Spot BTC ETFs had 241k trades yesterday. For the second day in a row, they collectively exceeded the number of trades is $SPY (blue) and $QQQ (green).

For context:
All 10 Spot BTC ETFs = $44B in assets and no options

SPY = $497B in assets and the most active options (and 0DTE options) on any options exchange.

QQQ = $253B is Assets and the most active options (and 0DTE options) on any options exchange.

0DTE (zero-days to expiration) options are now over 50% of all daily options volume in the United States. Most of the 0DTE volume is traded in $SPY and $QQQ.

0DTE volume will generate tremendous trading in the underlying assets ( $SPY and $QQQ). For the 10 Spot BTC ETFs to exceed $SPY and $QQQ trading WITHOUT any listed options was unthinkable a few weeks ago.
@JSeyffImage The black line is BTC's price (right scale)
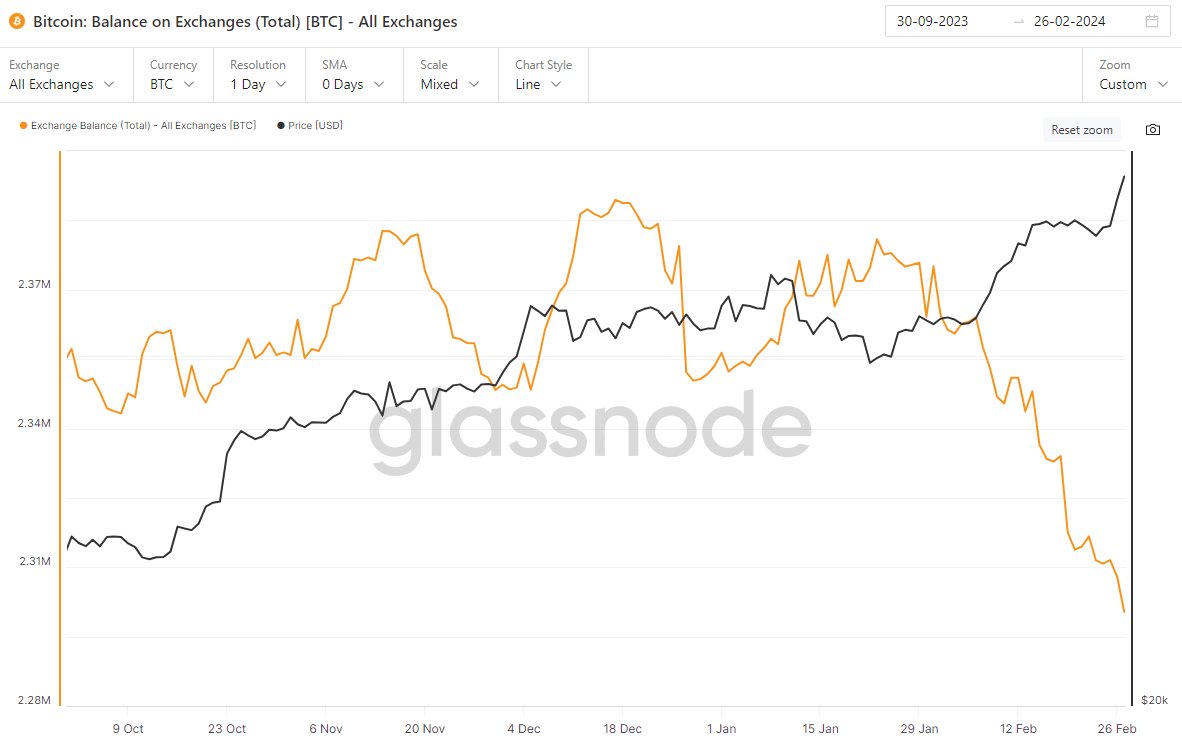
The orange line is the number of BTC coins on all centralized exchanges. (left scale)

Note the trend since January 11 (the start of Spot BTC trading). Straight down as the ETFs suck up the available supply of BTC.

All centralized exchanges currently hold 2.3 million BTCs, a 5 1/2 year low.Image
Feb 24 4 tweets 1 min read
1/4

I'm as guilty as anyone in putting together complex theories about what drives the 10-year yield.

Maybe it is really simple ...

10-year yields follow crude oil (which eventually becomes gasoline prices) Image 2/4

And the 10-year yield follows the Yen exchange rate. Image
Feb 19 6 tweets 2 min read
1/6

Everything you wanted to know about spot BTC ETFs in five charts.

(Remember 11 spot BTC ETFs started trading on January 11. Ten started with zero assets. Grayscale was a conversion from a closed-end fund, so it started with almost $29 billion in assets) Image 2/6

Flows into all the spot BTC ETFs.

(These are far away all-time records for the first few weeks for the ETF industry). Image
Feb 18 4 tweets 3 min read
1/4

Let me be clear by repeating some of the key points I mentioned in the video.

I love the idea of an alternative financial system, a way to store value, and a medium of exchange. But this alternative system has to be DECENTRALIZED! So, what am I? I'm a decentralization Maxi.

A spot ETF is NOT, repeat not, decentralized!

I'm a huge fan of BTC, ETF, and other DECENTRALIZED alternatives.

I've been a BTC Hodler for over seven years. I even held up my ledger to show how I own it and noted I'm not interested in buying a BTC ETF. It will be on my ledger if I add it to my position. 2/4

The fear I have over a spot BTC ETF is it is getting sucked into the same centralized system that the founders of crypto were trying to get away from. The idea that BTC will change the centralized system is pure fantasy.

If a spot BTC gets big enough, the centralized system will force the regulated brokerage accounts that hold the ETF, the regulated ETF providers, and the regulated exchanges to comply with its regulations and wishes. Not the other way around.

See this story; when the centralized Levithan is ready, they will do the same to spot BTC ETFs ... as they did to gold in 1934 when it became a "problem."

cointelegraph.com/news/gofundme-…
Feb 18 7 tweets 3 min read
1/7

Six weeks into 2024, the bond market is struggling ... again.
🧵
---
YTD total return (through Feb 16) of the Bloomberg Agg Bond Index is -2.04% (blue line).

Data started in 1976, so this is the 49th year of data.

Only 1980, 2018, and 2022 had a worse start. Image 2/7

The YTD total return (through Feb 16) of the Bloomberg GLOBAL Aggregate Bond Index is -3.18%

Data started in 1990, so this is the 35th year of data.

Only 2009 and 2022 had a worse start. Image