Chief U.S. Strategist for Ned Davis Research (NDR). The truth resists simplicity so let's debate in 280 characters. Charts over text. rt ≠ endorsements.


 7 subscribed
7 subscribed
7 subscribed
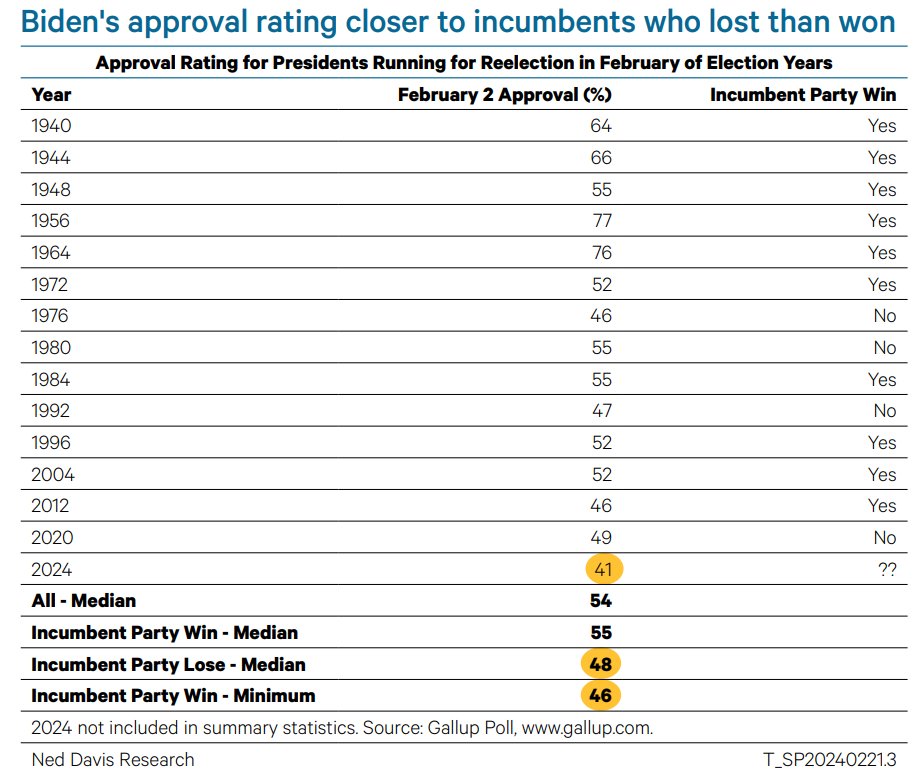 Taking Biden's reelection bid out of the equation, presidential approval acts like any sentiment indicator. A low % implies pessimism, which tends to be bullish for stocks.
 When the Fed has avoided recession, stocks have ripped higher, +24% 1 yr later.
 @NDR_Research 2. SPX trades not off EPS growth but the change in the growth rate. Consensus is calling for EPS growth to accelerate in CY24, which would be bullish.
 2. Partly due to the dour economic outlook, the market was ahead of the Fed in expecting rate cuts. A year ago fed funds futures expected the first cut in mid-2023. Powell followed through on his promise for higher for longer and is preparing for a mid-2024 first cut. 2/5
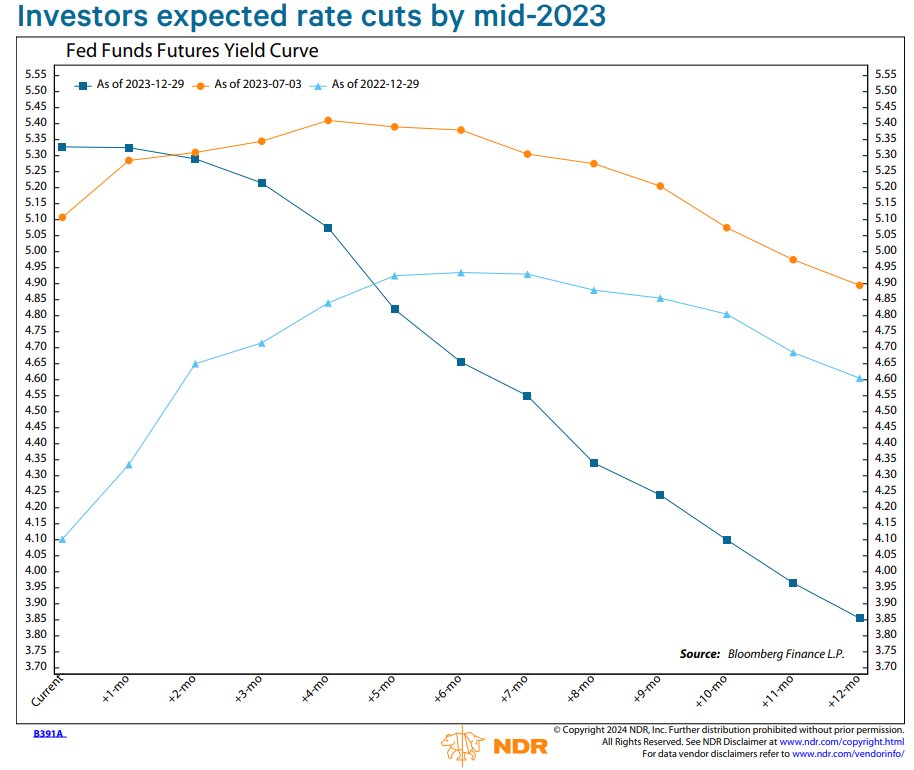
 What happened after the 3rd down month? A resumption of the uptrend has been more common than a continuation of the recent downtrend.
 2. Breadth weak in Q3 in both years. A big difference is in 2023, several breadth gauges made new cycle highs on summer rally. They failed to confirm in summer of 1987.
 Analysts are an optimistic bunch. Consensus SPX estimates prove to be 8% points too high one year ahead, on average.
 Valuations don't *seem* to be a major impediment. The forward and trailing P/E for the $SPX is modestly above its 40-year average. 2/6
 The sales beat rate is up to 73.9%, on pace for the best quarter since Q4 2021. Overall a positive, but the fact that the EPS beat rate rose more than the sales beat rate implies a modest shift from price increases to cost controls, a potential macro risk in future quarters. 2/5
 This chart makes more intuitive sense. It shows $SPX vs the change in the y/y change in EPS. Stocks have done best when EPS has been accelerating rapidly. 2/5
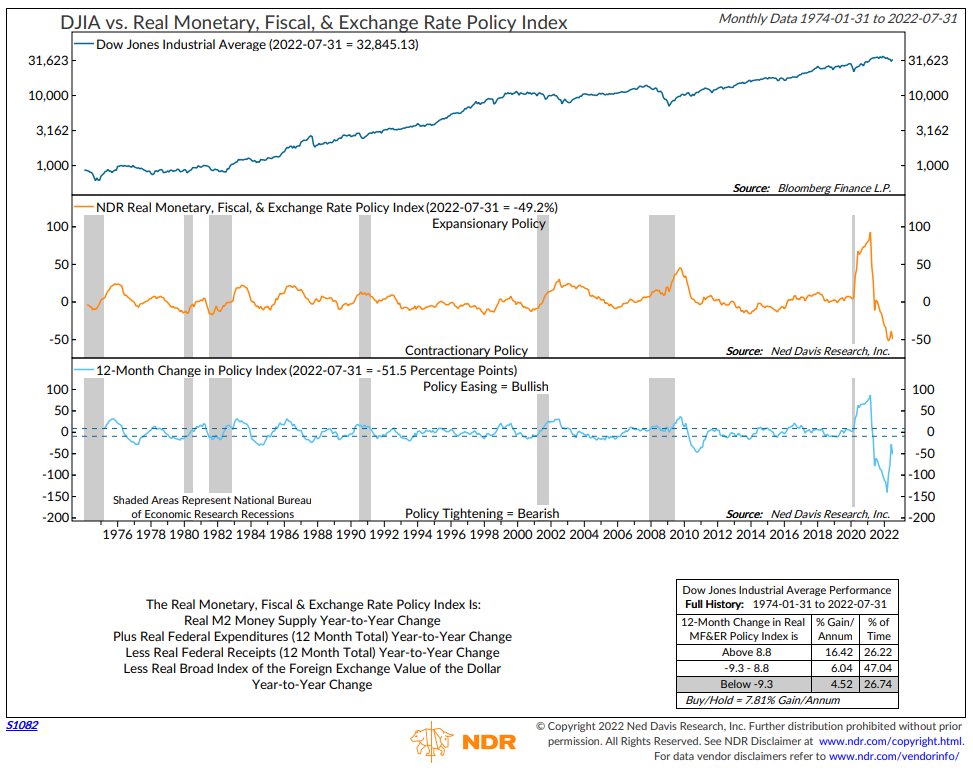
 A year ago gov’t spending was falling at its fastest rate since at least 1964. In April 2022 gov’t receipts were up 32%, the most since at least 1964. The combo meant the biggest fiscal tightening in over 60 years. Now, both are reversing. 2/8
 Powell has repeatedly said he is willing to push the economy into recession to get inflation in check. Bears end a median of 14 months after the last hike. The Fed is expected to hike again on March 22, implying the bear could continue well into 2024. 2/9
 2. We got 2x 10:1 up day signals in July and Nov 2022. We’ve adjusted our mantra from “trust the thrust” to “trust but verify.” One breadth thrust indicator that didn’t fire in 2022 but gave one on 1/12/23 was the NYSE 10-day advances/declines. @WalterDeemer 2/5
 2. We’ve said that this is NOT dotcom 2.0. Most mega-cap Growth stocks have positive cash flow. The early 1970s Nifty 50 is a better comparison. That being said, FANMAG is tracking major bubbles after they popped. If it walks like a duck, and quacks like a duck...2/5
 During shutdowns, FANMAG was among the few stocks whose business models thrived.
 2. Stocks tend to rally after mid-terms, even under 1st term Democrats. Note that mid-term years prior to elections have been esp. weak under 1st term Dems.
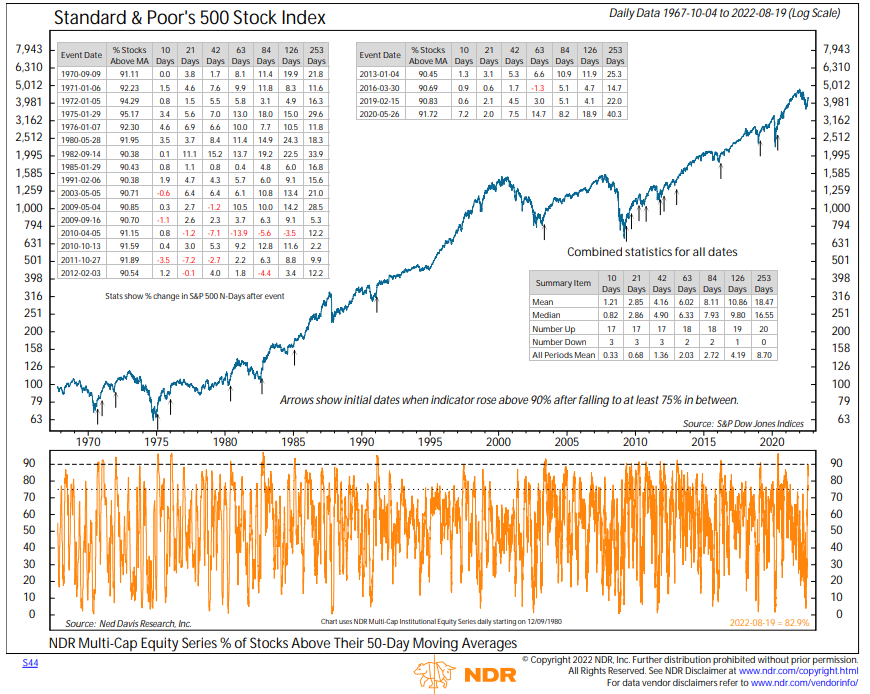
 2. Even if we had gotten a 2x 10:1 signal, the ⬆️ in breadth thrust signals recently means a mindset shift from "trust the thrust" to "trust but verify." LT breadth has yet to verify any ST breadth signals YTD. % stocks >50-day M.A. got to 61% on 11/1. Needs to be >90%. 2/5
 2. The presidential cycle is more than the market randomly flipping heads more often after midterms. The combo of monetary & fiscal policy typically bottoms before midterms and accelerates thru the pre-election year. 2/5
 2. The % stocks >10-day moving averages jumped from 6% on Tues to 86% on Fri. Has to climb above 90% to trigger a breadth thrust. 2/5
 2. An improvement in gov't policy would be in line with the presidential cycle. Monetary & fiscal policy tends to be restrictive after the presidential election, trough before midterm elections, and accelerate into the presidential election. r/t @WillieDelwiche 2/5
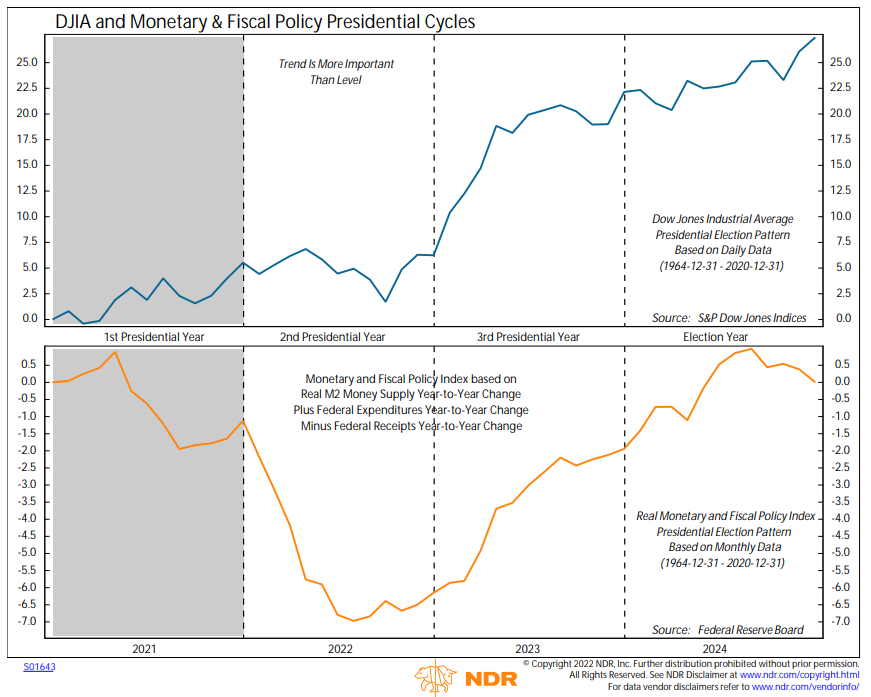
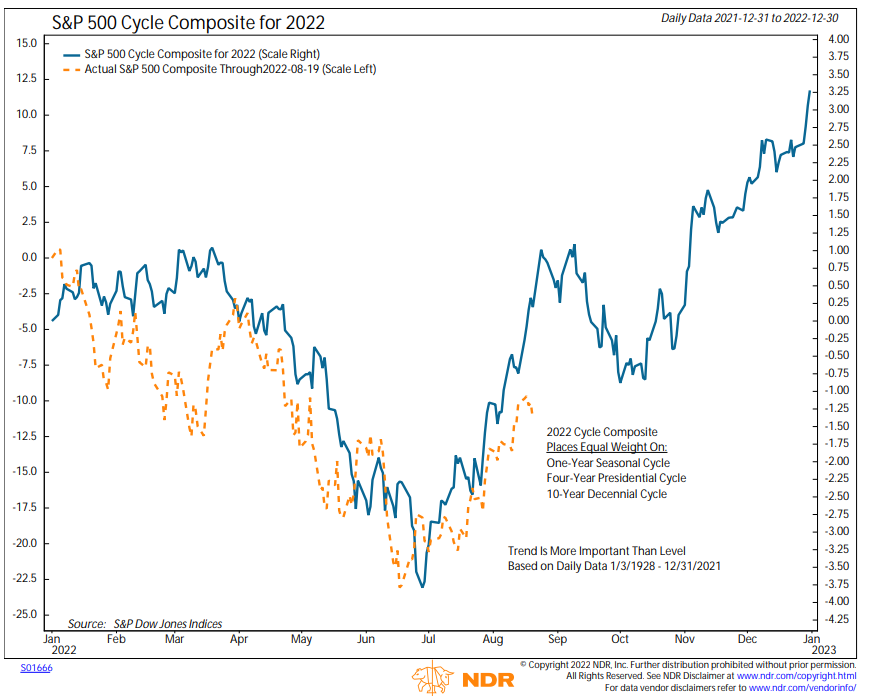
 2. Recent weakness is in line with the NDR Cycle Composite. Highs on 8/23 and 9/8 and low on 9/30.