
Professional insights for an options dominated world.
Gamma Exposure, Volatility, Market Breadth, Macro.
Now Exclusively Distributed through @Hedgeye


 4 subscribed
4 subscribed
4 subscribed
 2/ As a reminder, implied correlation can be thought of as the "discount" in $SPX volatility for the diversification benefit of the index. Yesterday's realized diversification benefit was low, but the market views this as a temporary condition.
 2/ In the space of a month, risk-free rates rose by 100bps AND credit spreads widened by 100bps, leaving very little imprint on the "safe" $SPX, but causing moderate chaos in fixed income markets.
 2/ The fact that we are regularly describing their positions should be a bit of a warning sign -- there's only so much notional size that can be deployed in simple strategies.
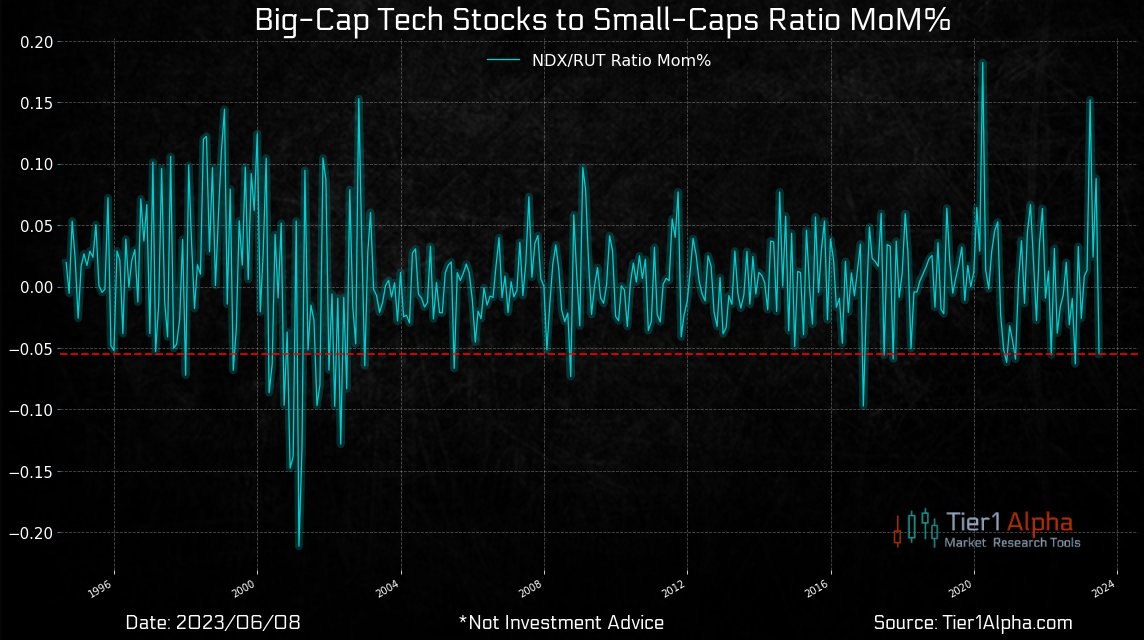
 2/ One of the more interesting charts that came out of our weekend work was the behavior of skew for the $NDX.
 2/ While that might seem scary, remember that around half of this Gamma is tied to weekly options, which are being hedged with further out-of-the-money contracts rather than hitting the futures market.
 2/ On a quarterly basis, a family of JP Morgan mutual funds must restrike a "sell call, buy put spread" structure. This is a highly visible trade also know as the JPM collar.
 2/ The trailing 12m average of new orders is now on par with the end of the GFC and there is an inevitable level of restocking that we should expect to eventually lead to recovery in this series. The continued weakness is likely increasingly influenced by growing USD strength.
 2/ From our model-based view, this failure to raise unemployment has been the key factor keeping passive inflows into the equity markets sustained.
 2/ The carry into realized is not so much the problem (we are pricing and realizing 11-13%) which makes it easy for dealers (who continuously delta hedge) to carry these positions, it's the roll down in the $VIX futures curve that is the killer.
 2/ What you just experienced is an unwind -- the selling of popular longs and unwind of popular shorts ahead of "events."
  2/ As noted by several sell-side shops, we saw meaningful upticks in S&P futures open interest as prices rose, suggesting a combination of FOMO from market participants caught offside and a growing narrative that hedge funds are "massively net short!" and must race to cover.
 2/ This mechanically means a portfolio of bonds & equities, the proverbial 60/40, has lower risk as the asset moves offset each other. All else equal, this allows more leverage to be used in portfolios AND that bonds function as a positive carry hedge to equities.
 2/ First launched in the early 1970s (by Wells Fargo on the institutional side and Vanguard on the retail side), they grew slowly to roughly 3% total market share by 1990. Today, the best estimates for passive penetration sit well over 40%.
 2/ Despite dire warnings from major financial institutions, equity markets are broadly whistling Dixie with the VIX sub-17 and short-dated VIX being pulled down by the low realized volatility. In other words, no real chance.
 2/ Unfortunately, yet again we find "errors" in BLS methodology that are failing to capture the full story. Claims are a function of two components -- a claim "rate" (claims per eligible employee) and the number of employees eligible. The excitement is in the latter for now