,
26 tweets,
9 min read
Read on Twitter
Will history repeat itself? The @TraceMayer Multiple indicated 4 major trend changes during the last two cycles: (1) Cycle low, (2) Correction #1, (3) Correction #2, (4) Cycle top. If history repeats, we might be close to Correction #1 at around $13k.
#BTC #Bitcoin
Thread 👇
#BTC #Bitcoin
Thread 👇

1/ During the last two bull markets, 3 of the 4 major corrections came in exactly at 2.5x the 200 DMA. Assuming that the low is in at $3150 and we are in a bull market, a current 200 DMA of $5070, suggests Correction #1 to take place at around $12,7k. Considering that
2/ the 200 DMA keeps increasing on the way up to 2.5x, the more realistic target would probably be around $13k. What would be the retracement target? During the last bull run, Correction #1 and #2 both came in at around 40%. This would put the downside target at around $7.8k.
3/ If the second last cycle is anything to go by, retracements could even exceed 50%. Looking at the recent run-up which was almost as steep and fast, this is not too unlikely. Therefore, this could suggest that the bottoming range for correction #1 could be between $6.5-$8.5k.
4/ You are wondering what the Mayer Multiple is all about?
Previous Mayer Multiple signaling and brief explanation of the indicator:
Previous Mayer Multiple signaling and brief explanation of the indicator:
Today´s 200 day moving average (DMA) is at $5,2k BTC. 2.5x the DMA would put the first major Bitcoin correction in this bull run exactly at around $13k BTC. Have we started the correction? 🧐
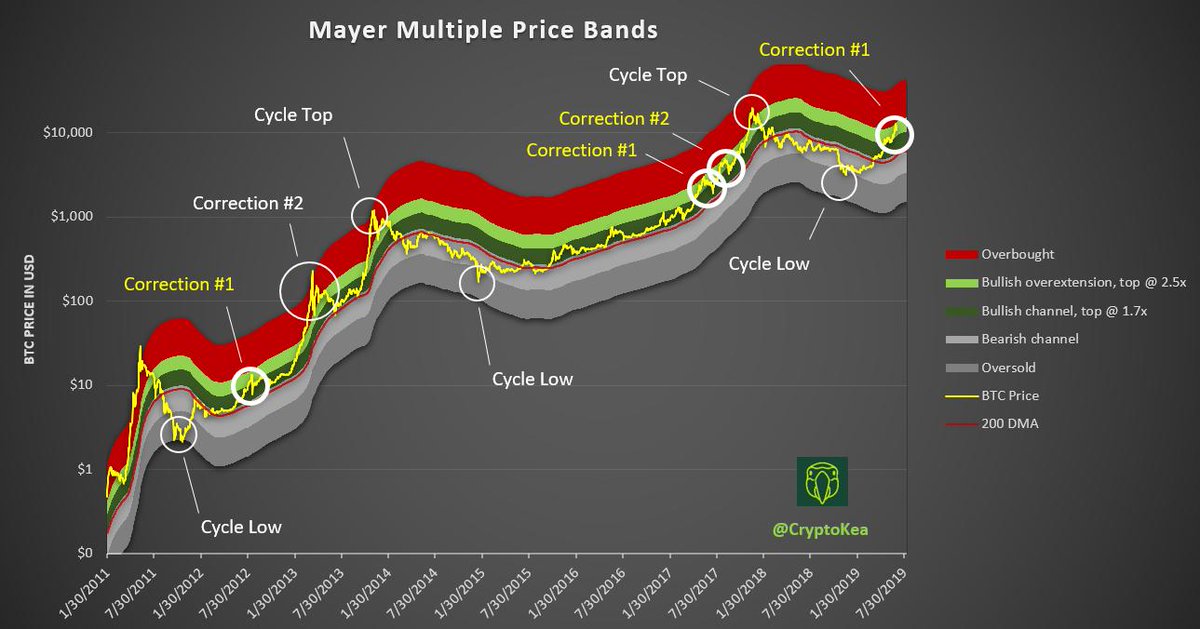
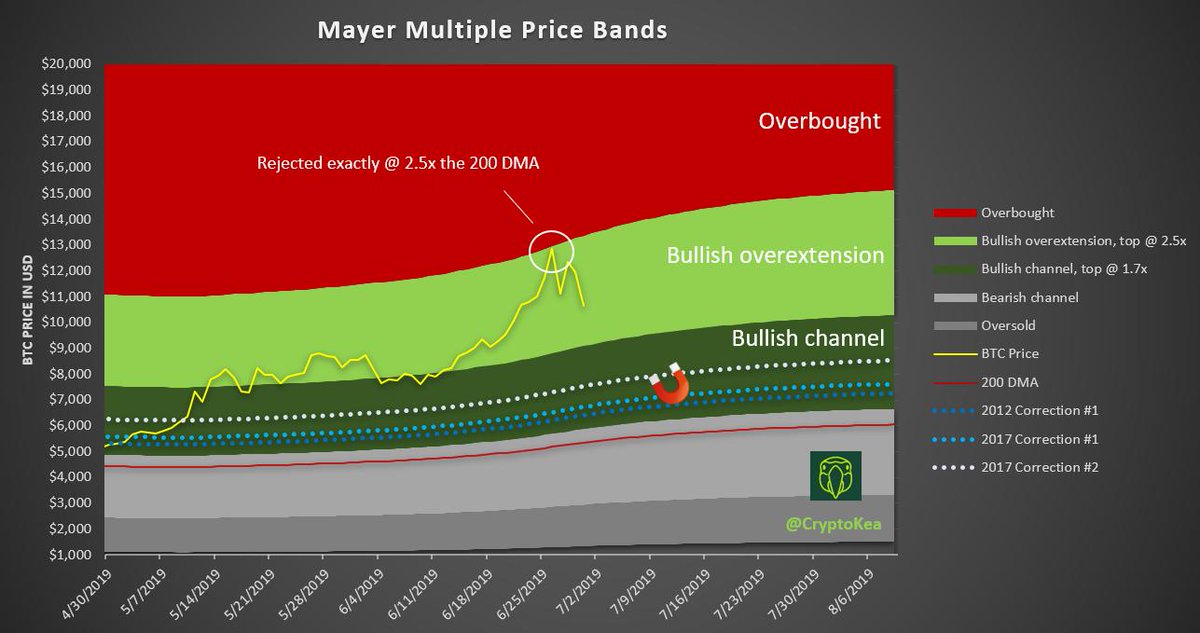
6/ Now that the first major correction target in this cycle got hit at 2.5x the 200 DMA, let´s have a closer look at the potential downside target. In order to do this, let´s first have a look at two major channels which #Bitcoin likes to trade in during a bull market to better
7/ understand the downside potential. The “bullish channel” (dark green) is a channel in which #Bitcoin likes to trade in during a bull market. When the bull market accelerates and FOMO takes over, the price even overshoots and gets into a channel of “bullish overextension”
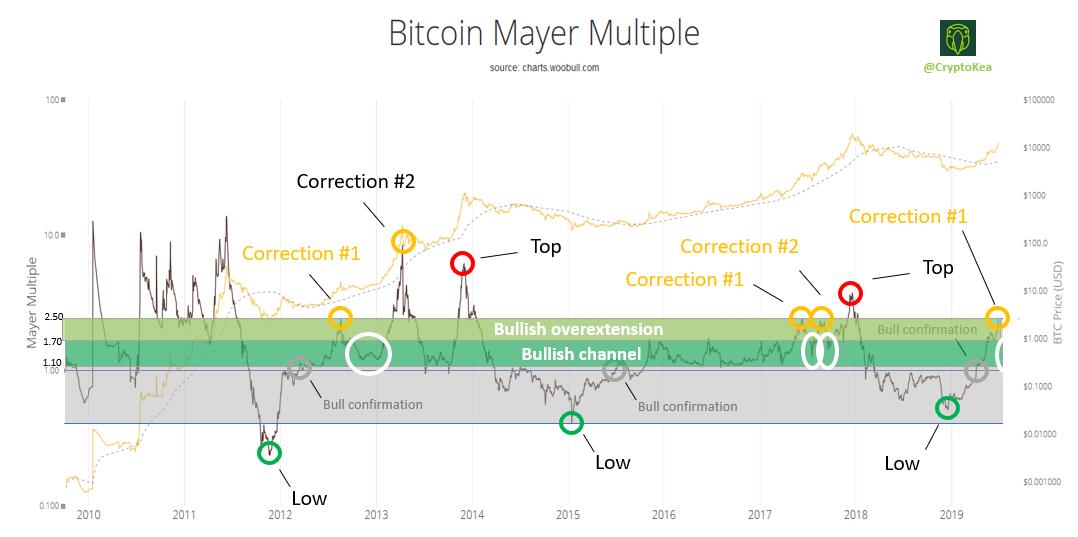
8/ (lighter green). Whenever this first happens during a new bull run, it comes to a halt and reverses 3 out of 4 times at 2.5x the 200 DMA which we hit at $12.9k. This was the case for the run-up in 2012 (Correction #1) and two times for the run-up in 2017 (Correction #1 & #2).
9/ Therefore, IF #Bitcoin´s price repeats similar retracements, we should expect the price to head down to 1.20x, 1.26x, or 1.41x the 200 DMA respectively. What does it mean in terms of price targets?
10/ Before we get to it, let´s have a look at the @TraceMayer Multiple in terms of trend defining multiple price bands. Here it can be very well seen how Bitcoin´s price tends to rest in the bullish zone, breaks-out of it and retraces back to it in bull markets (see corrections).
11/ Now let´s get to possible price targets for this correction and zoom in. IF #Bitcoin repeats a similar retracement pattern, where does a correction down to 1.20x, 1.26x and 1.41x comes in at in terms of price? As the 200 DMA keeps moving with every daily price close,
12/ I did a simple forecast of where it could be heading by plotting the multiples over time. As of now, the most likely retracement range is $6.6k - $8.5k. I know, this is a pretty nasty retracement, however, this was still a “natural” retracement in 2012 as it was in 2017
13/ and only lands us back into the “bullish channel”. Keep in mind, this projection does not have to happen, however, based on the historical accuracy of @TraceMayer Multiple, it is just much more probable than any major continued upwards move in the short-term.
14/ I even consider it a needed correction, as it could set us up for a much healthier, sustainable longer-term run-up to new ATHs.
15/ UPDATE on possible Mayer Multiple downside targets based on moving 200 DMA (currently @ $5,423 BTC)
Bullish zone, upper range @ 1.7x (minimum target) = $9,220
2017 Correction #2 @ 1.41x = $7,647
2017 Correction #1 @ 1.26x = $6,833
2012 Correction #1 @ 1.20x = $6,508
Bullish zone, upper range @ 1.7x (minimum target) = $9,220
2017 Correction #2 @ 1.41x = $7,647
2017 Correction #1 @ 1.26x = $6,833
2012 Correction #1 @ 1.20x = $6,508
16/ Keep in mind that the mayer multiples are fixed targets based on bullish correction bottoms seen in 2012 & 2017 and $ values are variable based on latest 200 DMA (which is currently trending upwards).
17/ I am a huge fan of @MMcrypto myself, very cool to see you guys devote a whole episode to this thread, very flattered and grateful 🙏. Huge shoutout to the MMcrypto team and Chris! I can highly recommed watching it:
18/ Since we had some wild price action recently, let´s have a look at updated charts, price targets and for the first time also at possible time targets:
The price of #Bitcoin is currently at $11.7k which equals 2x the 200 DMA, slowly getting closer to the first minimum bull
The price of #Bitcoin is currently at $11.7k which equals 2x the 200 DMA, slowly getting closer to the first minimum bull
19/ correction target of 1.7x the 200 DMA, which is the to be expected break-down level back into the bullish channel (dark green). First thing to note is, that there was NEVER a Bitcoin bull market where price did not come back first from the bullish overextension (light green)

20/ into the bullish channel (dark green). Therefore, the probability of #Bitcoin retracing to at least 1.7x the 200 DMA and lower is very high. The big question now: How long could it take and how deep could the correction be? Let´s have a look at the timing first.
21/ This is quite difficult to estimate as it is influenced by many factors, however, let´s give it a try and have a look at the history, if this is anything to go by. In 2012 correction #1 took only 3 days to re-enter the bullish zone, 2017´s correction #2 took 13 days.
22/ Looking at the current duration of the correction (16 days), this is off the table. Time-wise, it could be similar to 2017´s correction #1 where it took the price 27 days to correct down to 1.7x the 200 DMA. This means, if history was to repeat itself,

23/ price would re-enter the bullish zone in around 11 days from now and would translate into a target price of$9.891 (at a current 200 DMA of $5.818). However, I could see this taking almost twice as long to get there. Why? The current bullish zone is less steep than the
24/ bullish zone in the second half of 2017, making it more difficult to get there quickly if more sideway movements occur. Whereas the time targets for 2012 correction #1 and 2017 correction #2 are no longer in play, their price targets have not been invalidated.
25/ With 200 DMA at $5.818 and rising, current corrections targets are at:
1.7x the 200 DMA (back to bullish zone): $9.891 (minimum)
1.42x the 200 DMA (hitting 2017 correction #2 target): $8.261 (most probable)
1.26x the 200 DMA (hitting 2017 correction #1 target): $7.331
1.7x the 200 DMA (back to bullish zone): $9.891 (minimum)
1.42x the 200 DMA (hitting 2017 correction #2 target): $8.261 (most probable)
1.26x the 200 DMA (hitting 2017 correction #1 target): $7.331