Discover and read the best of Twitter Threads about #CopernicusAtmosphere
Most recents (24)

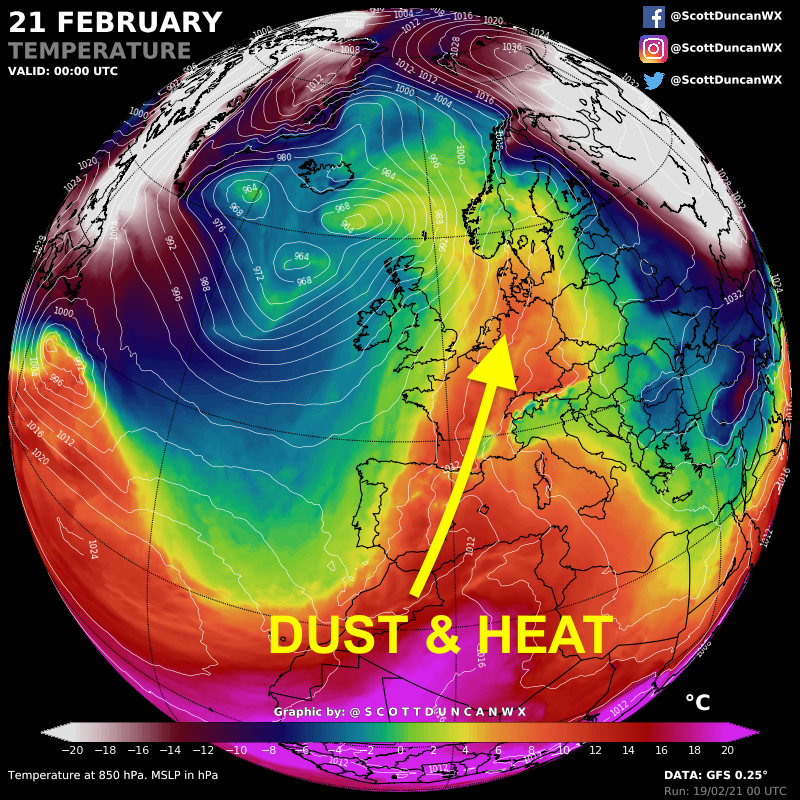
From Sahara to Scandinavia. We are in for another round of #dust and warmth widely across Europe.
The jet stream will buckle in an ideal fashion, optimising dust transport from the Sahara Desert to Scandinavia this weekend.
THREAD
The jet stream will buckle in an ideal fashion, optimising dust transport from the Sahara Desert to Scandinavia this weekend.
THREAD

The #CopernicusAtmosphere Monitoring Service forecast for aerosol optical depth ⬇️⬇️⬇️
@CopernicusEU @CopernicusECMWF
@CopernicusEU @CopernicusECMWF
A lot of dust has already pushed out of the Sahara into the western Atlantic. More to come though.


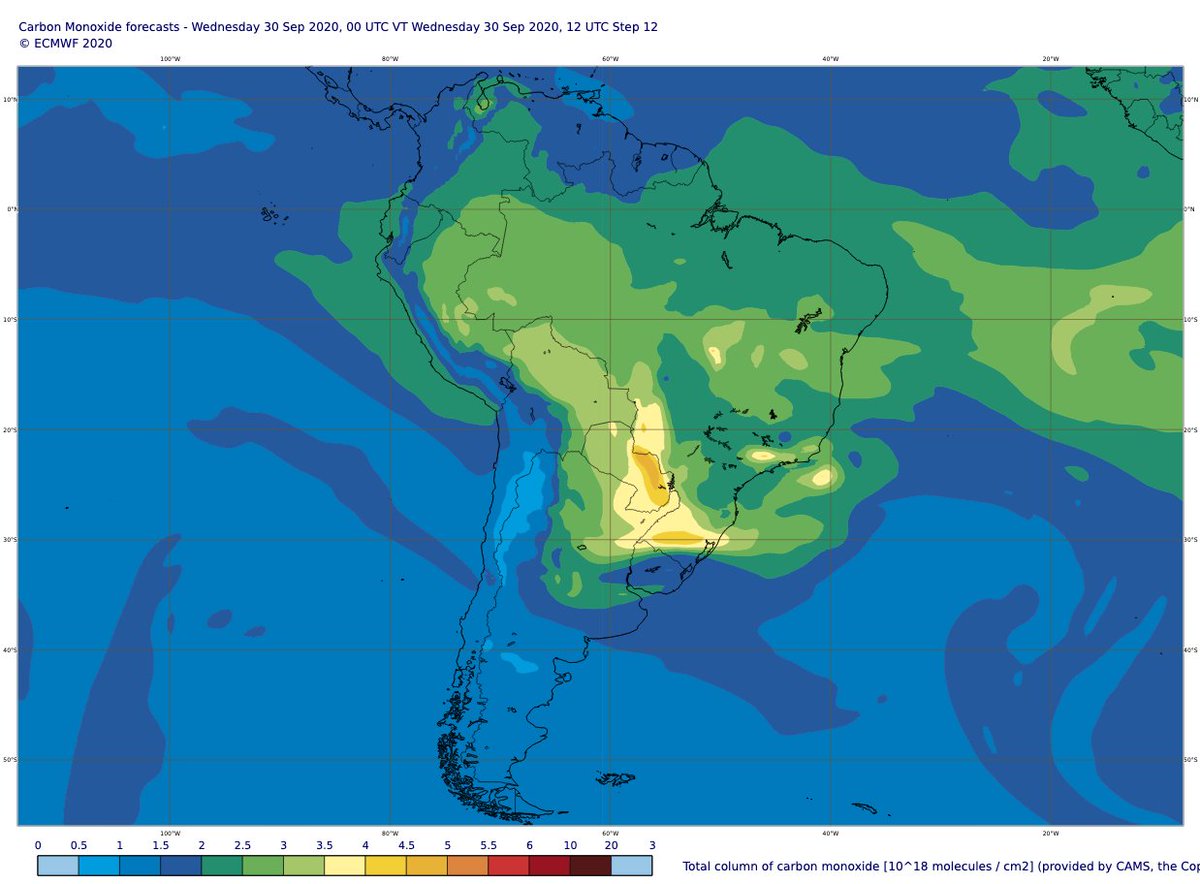
Smoke & #AirPollution across South America from active #wildfires #openburning, especially in S Brazil & N Argentina, in #CopernicusAtmosphere forecasts of aerosol optical depth⬅️, total column carbon monoxide↗️ & surface PM2.5↘️ atmosphere.copernicus.eu/charts/cams/


#CopernicusAtmosphere GFAS #opendata for Amazonia Legal & Mato Gross do Sul🇧🇷 showing daily total intensity since 1 August & estimated carbon emissions since 1 July. Generally similar to 2019 Pantanal fires increasing MGS data in recent days.

#CopernicusAtmosphere GFAS data for Argentina🇦🇷, Bolivia🇧🇴 & Paraguay🇵🇾 since 1 July

Latest @CopernicusECMWF Atmosphere Monitoring Service @ECMWF aerosol forecast (dataviz @windyforecast windy.com/-Aerosol-aod55…) shows thick smoke covering western US in coming days based on 28/09 #wildfires #AugustComplex #ZoggFire #GlassFire #ShadyFire #RedSalmonComplex
Updated monitoring of #CaliforniaFires with #CopernicusAtmosphere GFAS daily total #wildfire radiative power #opendata confluence.ecmwf.int/display/CKB/CA… showing incredible 6 weeks of activity >> 2003-2019 mean. Hoping that the current increase fails to reach mid-Aug & early-Sept peaks.

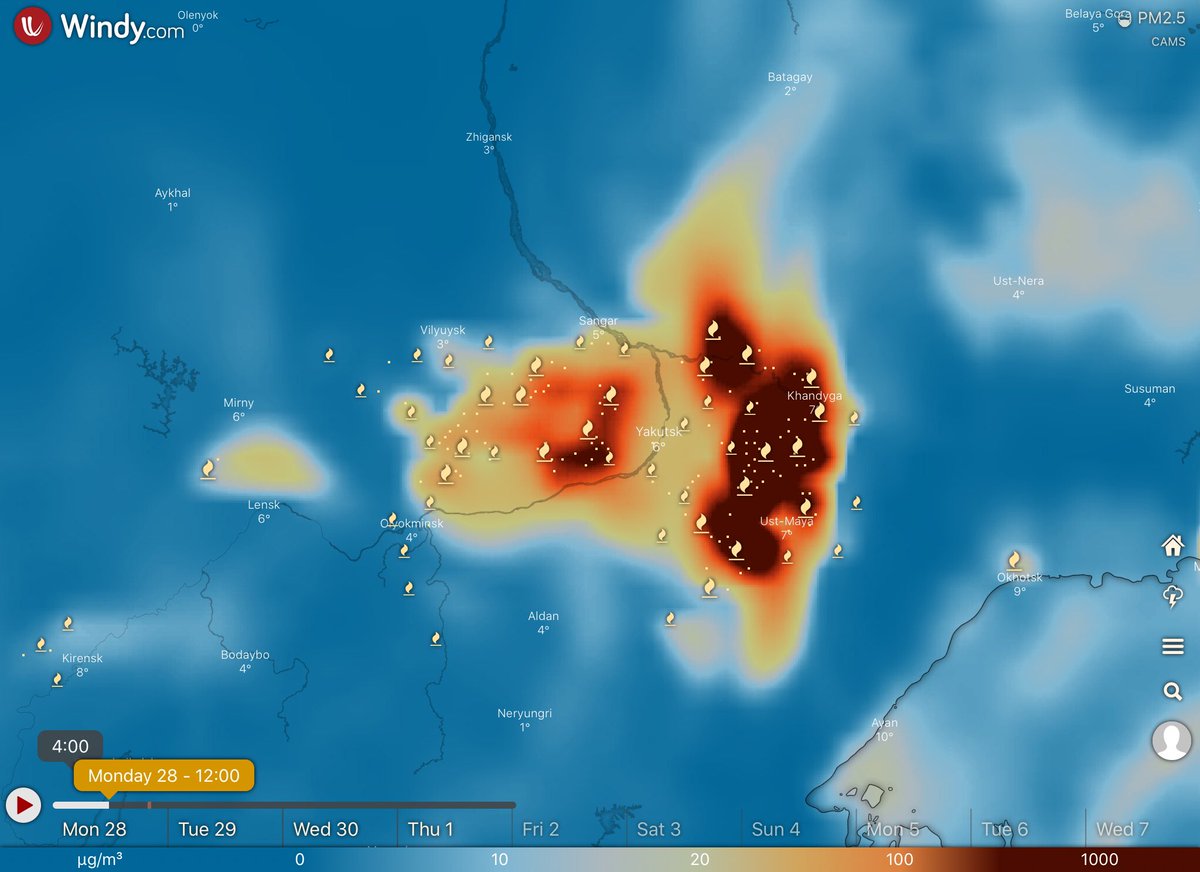
Escalation in daily total intensity & monthly total estimated emissions of #Yakutia #wildfires over the weekend in #CopernicusAtmosphere GFAS monitoring & continuing high surface PM2.5 #AirPollution in 28/09 forecast visualized by @windyforecast windy.com/-PM2-5-pm2p5?c…
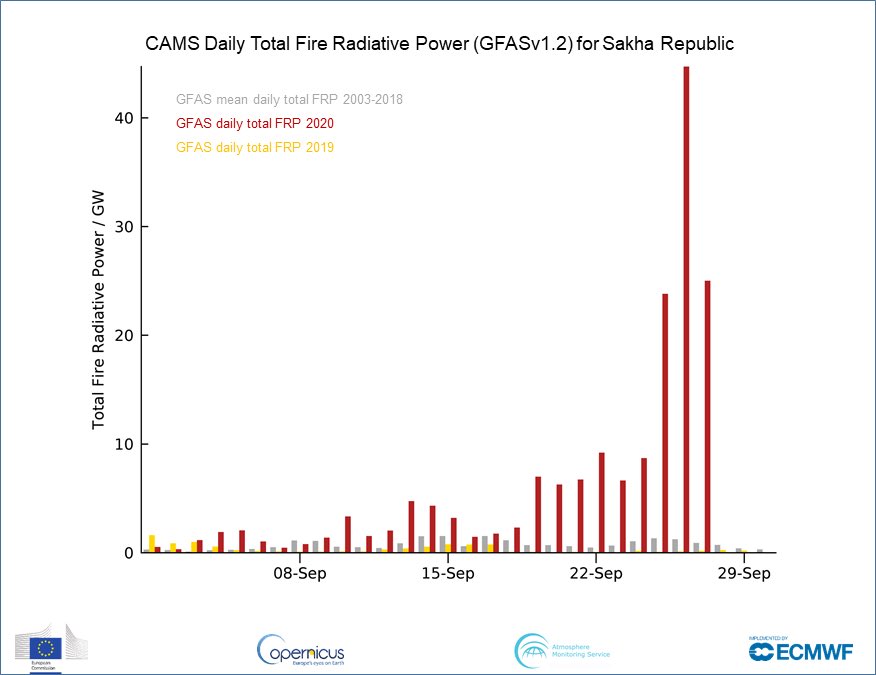

For context, current daily total intensity of #Yakutia #wildfires compared to the rest of the season from 1 June

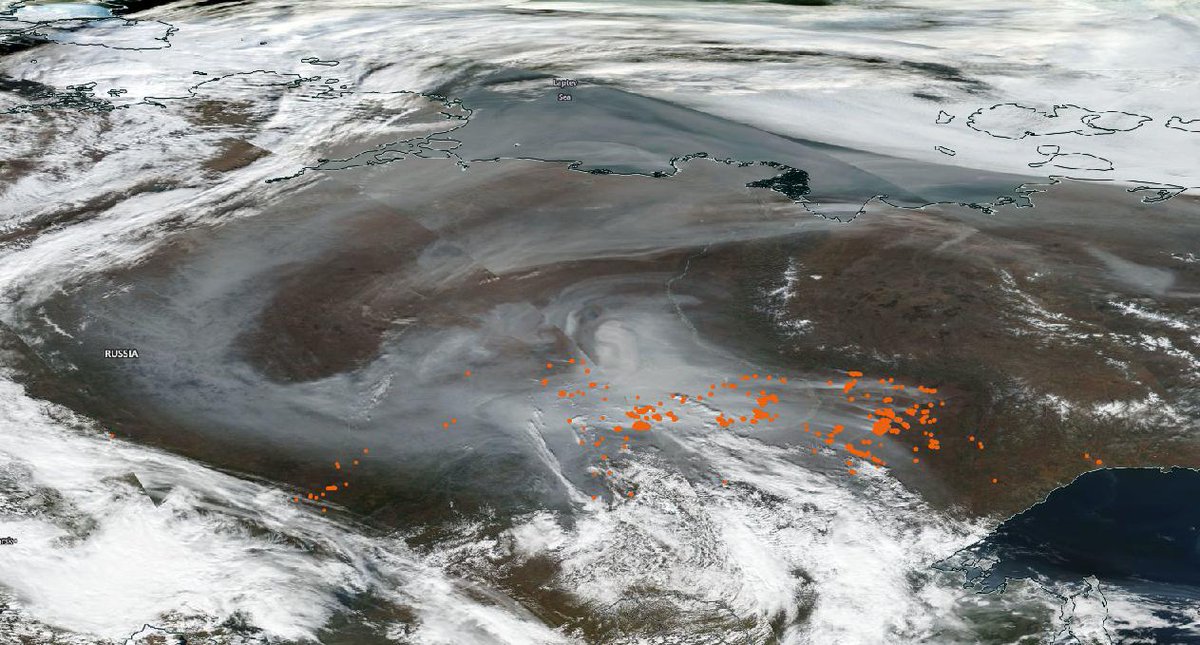
Several days of very active Sakha Republic #wildfires (&new September record emissions) in latest #CopernicusAtmosphere GFAS data & huge area of surface PM2.5 #airpollution windy.com/-PM2-5-pm2p5?c… & smoke go.nasa.gov/340kfVh extends from Yakutsk to Laptev Sea & #Arctic Ocean


More info on Global Fire Assimilation System (GFAS)➡️ confluence.ecmwf.int/display/CKB/CA…
Images show #CopernicusAtmosphere PM2.5 forecast initialized 00UTC 25/09, valid for 13UTC & Suomi NPP VIIRS🛰️ imagery at ~13UTC on 25/09
atmosphere.copernicus.eu
Images show #CopernicusAtmosphere PM2.5 forecast initialized 00UTC 25/09, valid for 13UTC & Suomi NPP VIIRS🛰️ imagery at ~13UTC on 25/09
atmosphere.copernicus.eu
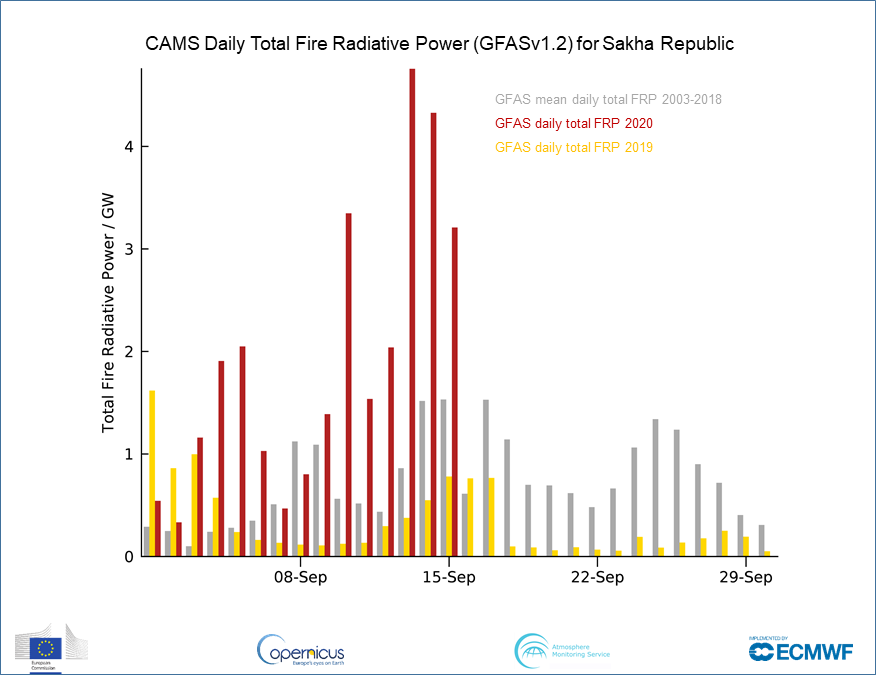
Increased daily total intensity, &smoke emissions, of active Sakha Republic #wildfires >> 2003-2018 mean in #CopernicusAtmosphere GFAS data confluence.ecmwf.int/display/CKB/CA…, comparable to only 3 previous years since 2003. #TerraMODIS🛰️ imagery go.nasa.gov/2ZYOniQ shows 23/09.


Increased #wildfires & smoke #airpollution around Yakutia & Sakha Republic in latest #CopernicusAtmosphere surface PM2.5 forecast visualized by @windyforecast windy.com/-PM2-5-pm2p5?c… & GFAS data to 20/09. @JPSSProgram VIIRS imagery shows smoke on 21/09 go.nasa.gov/35UrUah


High values of aerosol optical depth corresponding to #CaliforniaFires #OregonFires smoke crossing the North Atlantic to the Norwegian Sea & Scandinavia in the #CopernicusAtmosphere Monitoring Service forecast initialized at 00 UTC on 19/09 atmosphere.copernicus.eu/charts/cams/ae…

Looking ahead to 18 UTC on 20/09 shows smoke aerosol from western US #wildfires crossing northern Scotland & could lead to a spectacular sunset. S UK/N France may also see hazy skies with #SaharanDust @liamdutton @Schafernaker @LucyWeather @Lauratobin1 atmosphere.copernicus.eu/charts/cams/ae…

Thick smoke from #CaliforniaFires #OregonFires crossing North America & North Atlantic reaching Iceland & Scandinavia over weekend in latest @CopernicusECMWF Atmosphere Monitoring Service @ECMWF aerosol forecast visualized by @windyforecast windy.com/-Aerosol-aod55… #wildfires
Dark area of smoke aerosol from western US #wildfires over cloud in #TerraMODIS visible imagery for 17/09 go.nasa.gov/3iIPkmz corresponding to area of high AOD in #CopernicusAtmosphere forecast for 09UTC atmosphere.copernicus.eu/charts/cams/ae…


Late season #wildfires & smoke degrading local surface PM2.5 #airquality around Yakutsk & Sakha Republic, Russia in #CopernicusAtmosphere GFAS data & 24-h forecast visualized by @windyforecast windy.com/-PM2-5-pm2p5?c… & #AquaMODIS🛰️ imagery go.nasa.gov/2E6r3Yy


Thick smoke from continuing #CaliforniaFires #OregonFires crossing N America & eventually N Atlantic towards Iceland🇮🇸 & Norwegian Sea in latest @CopernicusECMWF Atmosphere Monitoring Service @ECMWF forecast visualized by @windyforecast windy.com/-Aerosol-aod55…
Note also sea salt aerosol from #HurricanePaulette, #SaharanDust and smoke from #wildfires in Portugal & Spain #IIFF
Latest monitoring data of daily total intensity & estimated annual total carbon emissions for western US #wildfires with #CopernicusAtmosphere GFAS #opendata confluence.ecmwf.int/display/CKB/CA…. #CaliforniaFires #OregonFires & #WashingtonFires continue >> 2003-2019 mean #wildfires2020 #IIFF


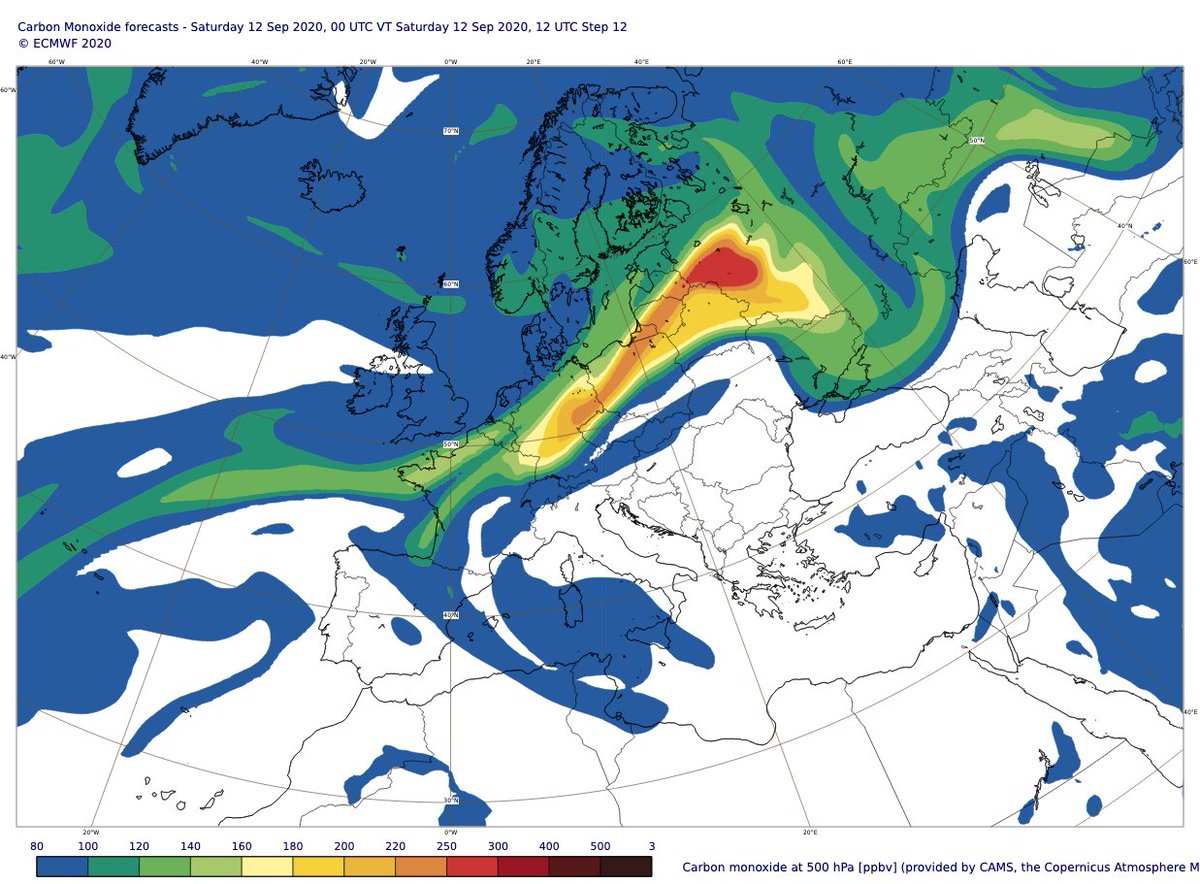
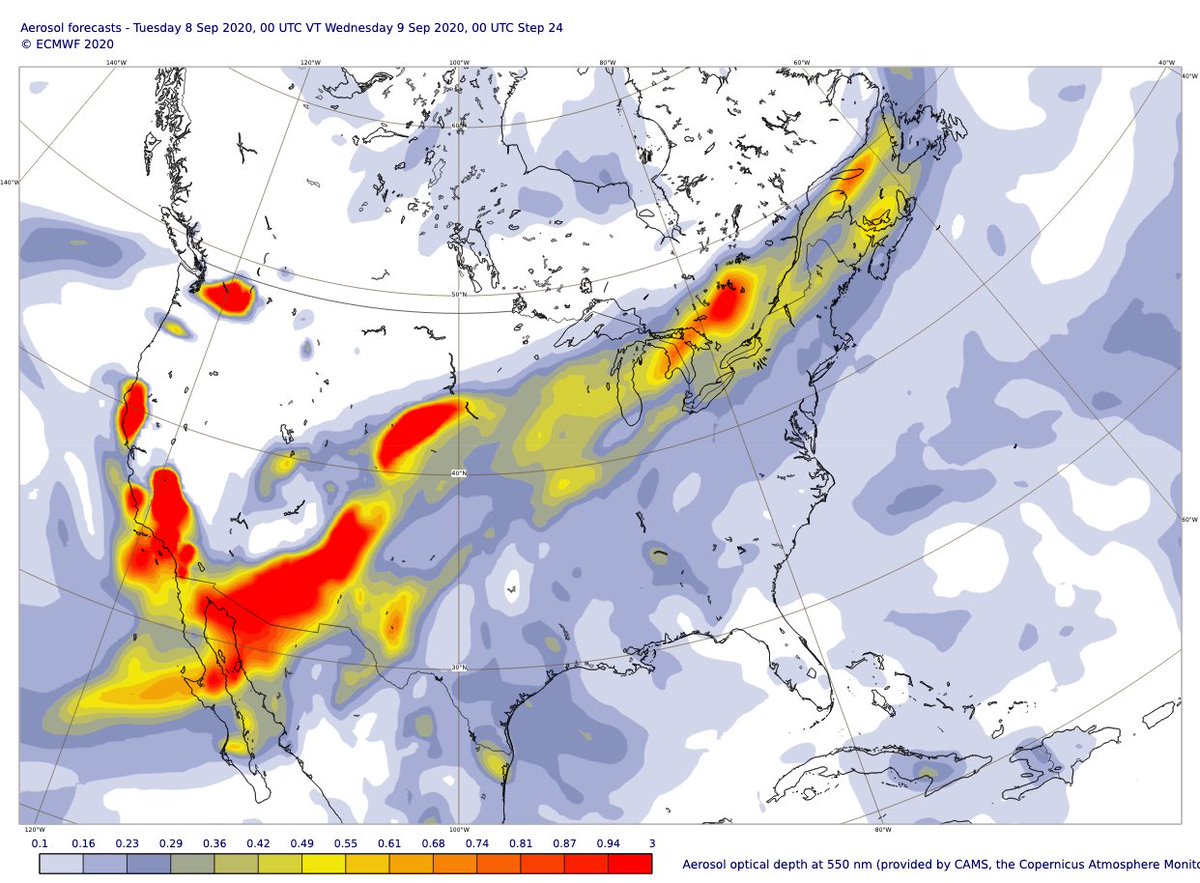
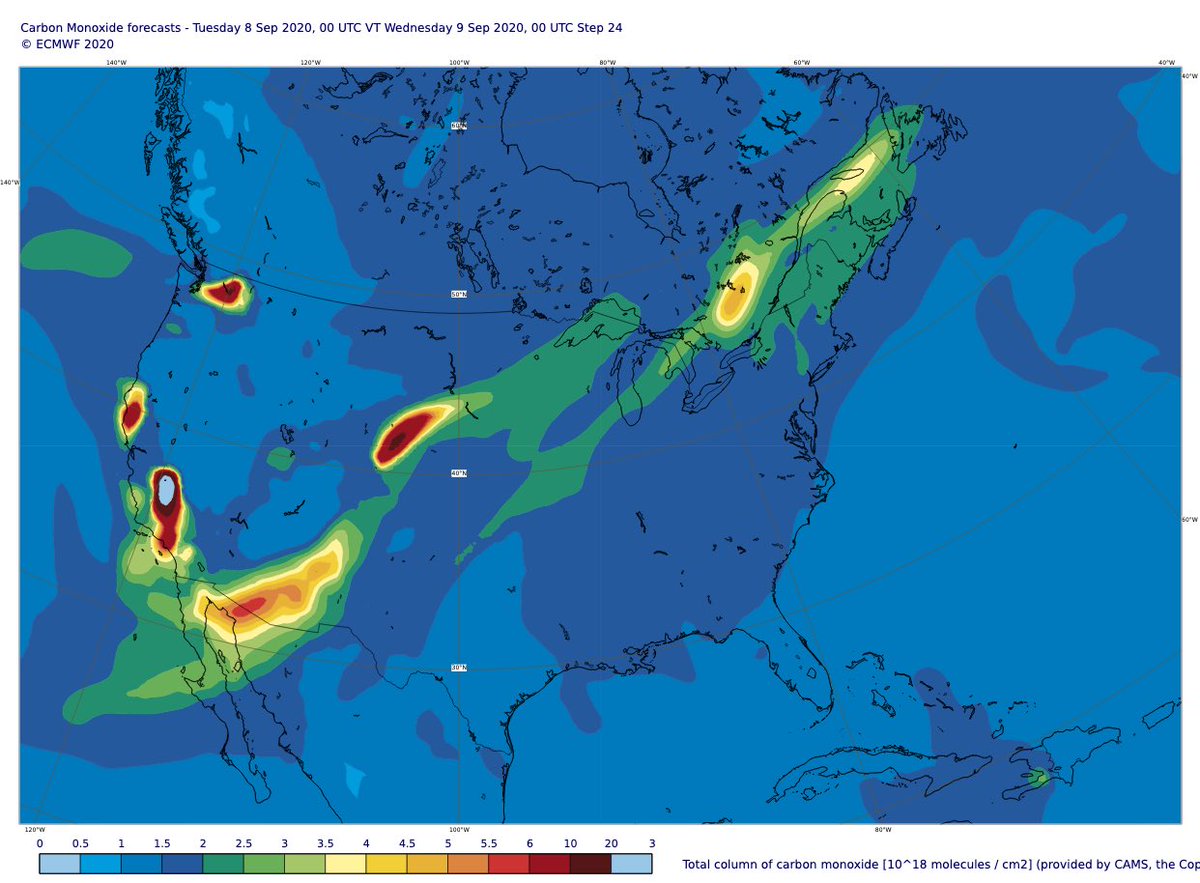
#CaliforniaFires smoke transport over N Europe is clearly apparent in today's #CopernicusAtmosphere Monitoring Service 12 UTC total aerosol optical depth & carbon monoxide at 500hPa (~5km) forecasts. Looking forward to comparing against @IAGOS_RI ✈️ measurements @ThouretV

Explore more with latest charts:
Aerosol optical depth ➡️ atmosphere.copernicus.eu/charts/cams/ae…
Carbon monoxide at 500hPa ➡️ atmosphere.copernicus.eu/charts/cams/ca…
Aerosol optical depth ➡️ atmosphere.copernicus.eu/charts/cams/ae…
Carbon monoxide at 500hPa ➡️ atmosphere.copernicus.eu/charts/cams/ca…
Updated monitoring of devastating & deadly western US #wildfires with #CopernicusAtmosphere GFAS data based on MODIS active fire obs. Daily total intensity >> 2003-2019 mean & estimated annual total carbon emissions confirm record scale of #CaliforniaFires & #OregonFires #IIFF


Today’s #CopernicusAtmosphere Monitoring Service aerosol optical depth forecast valid for 11 Sept at 00 UTC atmosphere.copernicus.eu/charts/cams/ae… shows #CaliforniaFires smoke over Ireland before crossing UK & North Sea throughout Friday #wildfires #IIFF

@David_P_Moore @colin_seftor @SanGasso @VHPeuch @RichardJEngelen @AntjeInness @Mel_Ades @AtmosChemYork @jimmcquaid @clarenoone @Mace_Head @DrGaryFuller @BBCAmos @dpcarrington @Seana_Davis @liamdutton @Lauratobin1 @DrTELS @centrewildfires @AerosolWatch
Only just noticing the length of the yellow plume (AOD > 0.5) stretching right across the North Atlantic. At first it reminded me of this forecast from June 2019 & link to more information on how we monitor fires & long-range transport of smoke pollution
Escalation of devastating #wildfires, smoke & surface #airpollution across entire western US with very high levels of surface PM2.5 for the coming days. @CopernicusECMWF Atmosphere Monitoring Service @ECMWF forecast initialized 9 Sept at 00 UTC visualized by @windyforecast
Link to forecast ➡️ windy.com/-PM2-5-pm2p5?c… #CAwx #CaliforniaFires #ORwx #OregonFires #WAwx #WashingtonFires #COwx #ColoradoFires #UTwx #UtahFires
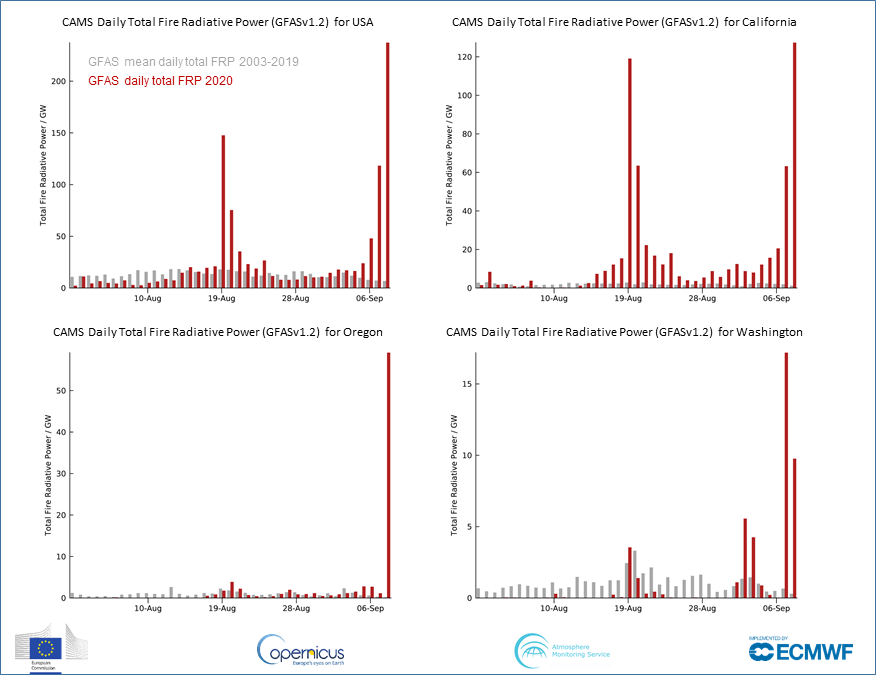
1 Aug - 8 Sept 2020 daily total #wildfire radiative power (cf 2003-2019 mean) for US, #CaliforniaFires, #OregonFires & #WashingtonFires from #CopernicusAtmosphere Monitoring Service GFAS data confluence.ecmwf.int/display/CKB/CA… based on NASA MODIS 🛰️ active fire observations #wildfireseason
Clear increase in daily total intensity of #CaliforniaFires & #ColoradoFires on 7 Sept >> 2003-2019 mean in #CopernicusAtmosphere GFAS data. Latest 24-hour aerosol & carbon monoxide forecasts show long-range transport of smoke extending across the US from SW to NE.


Aerosol forecast charts ➡️ atmosphere.copernicus.eu/charts/cams/ae…
Carbon monoxide forecast charts ➡️ atmosphere.copernicus.eu/charts/cams/ca…
Carbon monoxide forecast charts ➡️ atmosphere.copernicus.eu/charts/cams/ca…
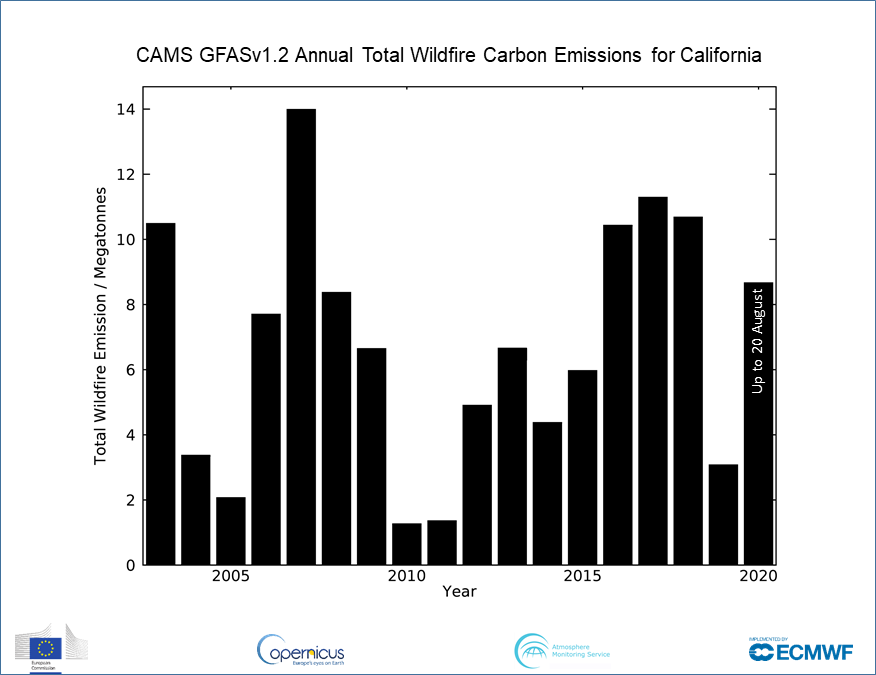
Incredible scale of ongoing #CaliforniaFires with total estimated #wildfire emissions for California to 7 Sept 2020 already state’s highest annual total in 18-year #CopernicusAtmosphere GFAS dataset (Colorado achieved this in August) confluence.ecmwf.int/display/CKB/CA… #CAfire #COfire


As #wildfires increase across western US today’s #CopernicusAtmosphere Monitoring Service surface PM2.5 & aerosol forecasts for 12UTC, based on 🛰 fire & smoke obs from 6 Sept, show smoke impact on #airquality spreading eastwards. Visualized by @windyforecast


PM2.5 forecast ➡️ windy.com/-PM2-5-pm2p5?c…
Aerosol Optical Depth forecast ➡️ windy.com/-Aerosol-aod55…
More info ➡️ atmosphere.copernicus.eu
Aerosol Optical Depth forecast ➡️ windy.com/-Aerosol-aod55…
More info ➡️ atmosphere.copernicus.eu
Latest #CopernicusAtmosphere info on #CaliforniaFires.
High surface PM2.5 in 24-hour forecast windy.com/-Aerosol-aod55…, valid at 00 UTC on 6 Sept, based fire obs from 4th & hopefully doesn't change dramatically as daily total intensity has been >> 2003-2019 mean since mid-August.
High surface PM2.5 in 24-hour forecast windy.com/-Aerosol-aod55…, valid at 00 UTC on 6 Sept, based fire obs from 4th & hopefully doesn't change dramatically as daily total intensity has been >> 2003-2019 mean since mid-August.


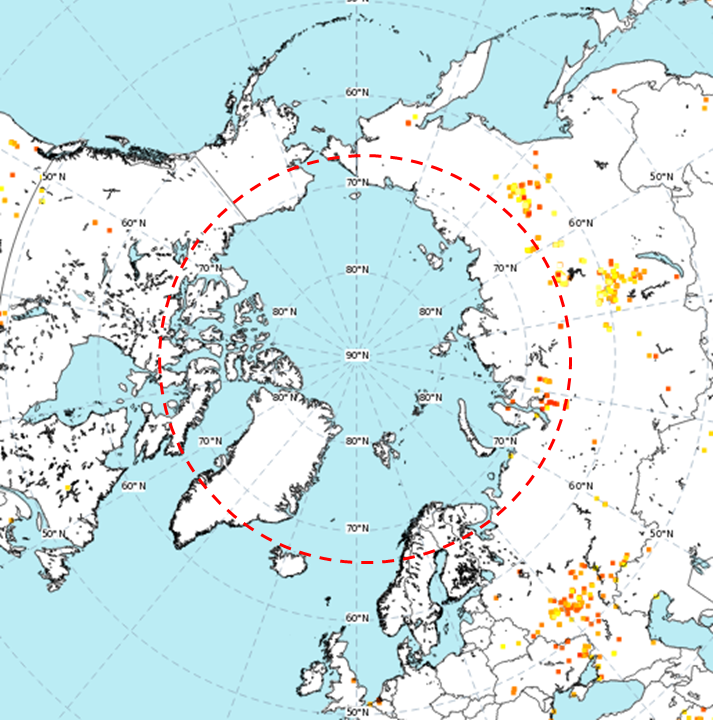
Analyses of organic matter aerosol optical depth, based on 🛰️ obs, showing large-scale smoke transport around N Hemisphere from #Siberia #ArcticFires (& #CaliforniaFires) between 1 Aug to 2 Sept 2020. @CopernicusECMWF Atmosphere Monitoring Service @ECMWF atmosphere.copernicus.eu
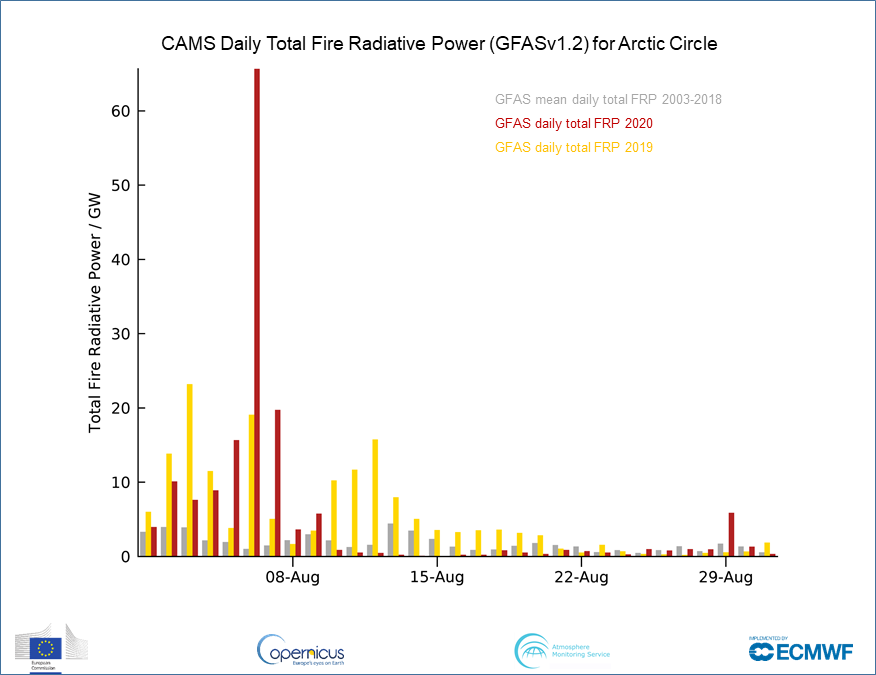
#ArcticFires were very active in first week of August 2020 but reduced to more usual activity for most of the month with slight increase as summer came to an end. #opendata from #CopernicusAtmosphere Global Fire Assimilation System based on MODIS 🛰️ obs confluence.ecmwf.int/display/CKB/CA…


Quick initial evaluation of #CopernicusAtmosphere Monitoring Service AOD forecasts in relation to long-range transport of #CaliforniaFires & #ColoradoFires smoke vs. Aeronet measurements at Fresno & @NASAAmes CA, Sterling CO, Missoula MT, N Great Plains ND & Sioux Falls SD

More info on Aeronet measurements at aeronet.gsfc.nasa.gov. #Copernicus Atmosphere Monitoring service forecasts are initialized from analyses which assimilate satellite observations - independent measurements such as Aeronet are essential to evaluation and validation
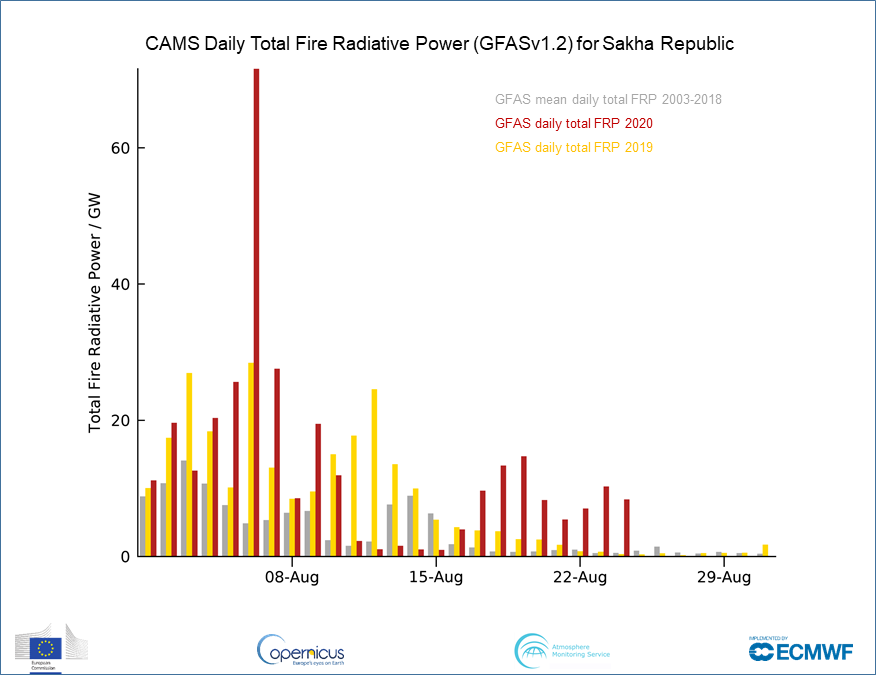
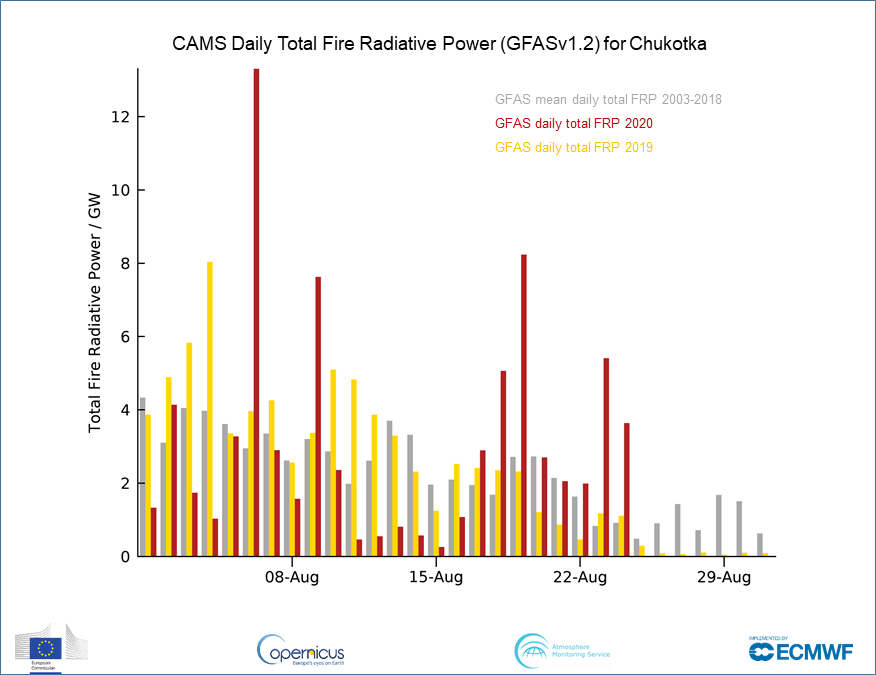
Peak #ArcticFires activity seems a long time ago but Sakha Republic & Chukotka🇷🇺still experiencing above average daily total #wildfire intensity for late August in #CopernicusAtmosphere GFAS data to 24/08. #TerraMODIS🛰️imagery shows continuation on 25/08 go.nasa.gov/3ldIDKV

#Wildfire activity in other parts of #Siberia has been relatively low all summer. Krasnoyarsk & Irkustk have been experiencing increased daily total intensity over last 2 weeks close to 2003-2018 mean & << 2019.


Global Fire Assimilation System data based on MODIS obs (only Terra available since 17 August)➡️ confluence.ecmwf.int/display/CKB/CA…
Latest maps➡️ atmosphere.copernicus.eu/charts/cams/fi…
NASA imagery➡️ go.nasa.gov/3ldIDKV
Latest maps➡️ atmosphere.copernicus.eu/charts/cams/fi…
NASA imagery➡️ go.nasa.gov/3ldIDKV
More context for scale of #CaliforniaFires comparing 2020 daily total estimated #wildfire carbon emissions (red) with highest daily totals between 2003-2019 (grey). 19 August 2020 peak highest in 18 year #CopernicusAtmosphere GFAS dataset (previous highest was in October 2003).

Smoke from #CaliforniaFires already covering huge area of western US/Canada & predicted to continue eastwards across the Great Lakes to the North Atlantic in @CopernicusECMWF Atmosphere Monitoring Service @ECMWF forecast visualized by @windyforecast windy.com/-Aerosol-aod55…
Daily total fire radiative power of #CaliforniaFires & #ColoradoFires continues >> 2003-2019 mean in #CopernicusAtmosphere GFAS data with 2020 already the highest annual total estimated #wildfire carbon emissions for Colorado.


Thick smoke plumes from escalating scale & intensity of #wildfires in California, Colorado & western US predicted to spread across N America in latest @CopernicusECMWF Atmosphere Monitoring Service @ECMWF aerosol forecast visualized by @windyforecast windy.com/-Aerosol-aod55…
#AirPollution related to #CaliforniaWildfires & #ColoradoWildfires affecting huge area in #CopernicusAtmosphere Monitoring Service 24-hour forecasts (init 00 UTC, 20/08/2020) of ⬅️total column carbon monoxide, ↗️surface CO concentration & ↘️surface PM2.5 concentration #airquality


Latest charts at atmosphere.copernicus.eu/charts/cams/
