Discover and read the best of Twitter Threads about #uptrend
Most recents (13)

From #bearish to #bullish: #crypto trends signal a potential buying opportunity at $27,500 for #Bitcoin and #Ethereum outperformance 🧵🧵
Sub to our TG for the latest: t.me/matrixportupda…
Sub to our TG for the latest: t.me/matrixportupda…

#Crypto #sentiment has cooled off, with our #Bitcoin Greed & Fear Index dropping to 44 (for #Ethereum, 46). Buying half a position at $27,500 could be a good re-entry level, with the possibility of the price dropping to $25,000 for the second half.
The decline in #stablecoin #marketcap suggests money is leaving the ecosystem, with #USDC and #BUSD dropping below $30bn and $6.5bn, respectively. Negative #funding rates for #Binance #BNB could indicate potential negative news.


6 Pullback Trading Strategies for Beginners (🧵)

1. Trendlines: The Simplest of them all. After determining the trend's direction(quickly done using Swing High and Lows)👇

A sequence of higher highs, followed by a series of higher lows, constitute an #uptrend. Similarly, a line of lower lows and lower highs include a #downtrend👇

#Nifty #BankNifty are in final phase of the prolonged last 6 months, where they've been busy separating very few men out of so many boys in #Markets 1/n
#FII selling of record numbers didnt break the market much beyond say 10% decline on the #Indices indicating longer term strength still 2/n
Yet in the shorter term #GreatResults from every blue chip met with an immediate trading top. Hmm... good news is not impacting... 3/n
5 Most Used Indicators by Swing Traders:
A Thread (🧵)... (1/18)
A Thread (🧵)... (1/18)

1. Moving Averages: The most simple indicator out there, used by both amateur, as well as experienced #Swingtraders! This indicator takes into account the closing prices of specific periods and Averages them out👇 (2/18)

Periods may be categorized into short, medium, or long-term! For example, a 7-day, 50-day, and 200-day #MovingAverage may be considered👇
(3/18)
(3/18)

Analysis: #NYSE $STZ
Case 332 #Constellation_Brands Inc.
DISCLAIMER: The analysis is strictly for educational purposes and should not be construed as an invitation to trade.
#STZ 1/4
Case 332 #Constellation_Brands Inc.
DISCLAIMER: The analysis is strictly for educational purposes and should not be construed as an invitation to trade.
#STZ 1/4

Chart 1
Monthly Chart: A serious #downdraft in Feb - Mar 2020 led to the break of the 2019 range bottom creating long term damage to the #uptrend. The inability to gain a foothold above the 2019 range top at 211.67 is deeply .....
STZ 2/4
Monthly Chart: A serious #downdraft in Feb - Mar 2020 led to the break of the 2019 range bottom creating long term damage to the #uptrend. The inability to gain a foothold above the 2019 range top at 211.67 is deeply .....
STZ 2/4

Analysis: #NYSE $HON
Case 268 #Honeywell International Inc.
DISCLAIMER: The analysis is strictly for educational purposes and should not be construed as an invitation to trade.
#HON 1/4
Case 268 #Honeywell International Inc.
DISCLAIMER: The analysis is strictly for educational purposes and should not be construed as an invitation to trade.
#HON 1/4

Chart 1
Weekly Chart: The steep and violent decline from Jan. 2020 has created long term damage to the #uptrend - the last time price traded below the SMA 200 was back in Oct. 2011. Formidable #resistance is .....
HON 2/4
Weekly Chart: The steep and violent decline from Jan. 2020 has created long term damage to the #uptrend - the last time price traded below the SMA 200 was back in Oct. 2011. Formidable #resistance is .....
HON 2/4


#DXone_Indicators [14/04/20]: #AroonIndicator
It shows whether the #crypto is #TRENDING.
The indicator comprises of an #AROON_UP (Yellow) and an #AROON_DOWN line (Blue).
Rising AROON-UP+Falling AROON-DOWN = #Uptrend
Falling AROON-UP+Rising AROON-DOWN = #Downtrend
It shows whether the #crypto is #TRENDING.
The indicator comprises of an #AROON_UP (Yellow) and an #AROON_DOWN line (Blue).
Rising AROON-UP+Falling AROON-DOWN = #Uptrend
Falling AROON-UP+Rising AROON-DOWN = #Downtrend
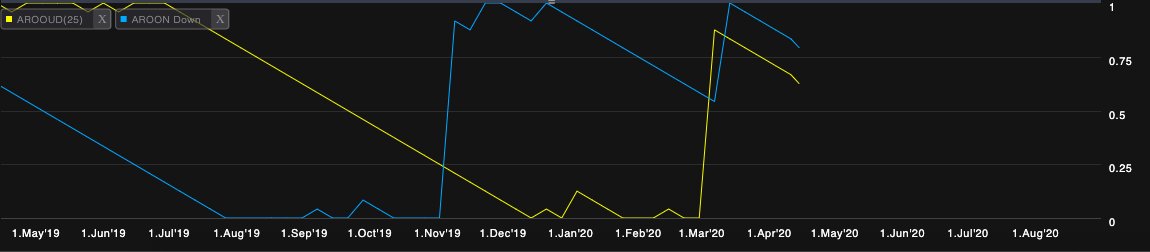
Sign Up at dxone.com to check out all 68 technical indicators available for the professional traders.
#trading #cryptocurrency #CryptoNews #Crypto #cryptocurrencies #Bitcoin #LearningNeverStops #TuesdayThoughts #bitcoin #cryptotwitter
#trading #cryptocurrency #CryptoNews #Crypto #cryptocurrencies #Bitcoin #LearningNeverStops #TuesdayThoughts #bitcoin #cryptotwitter

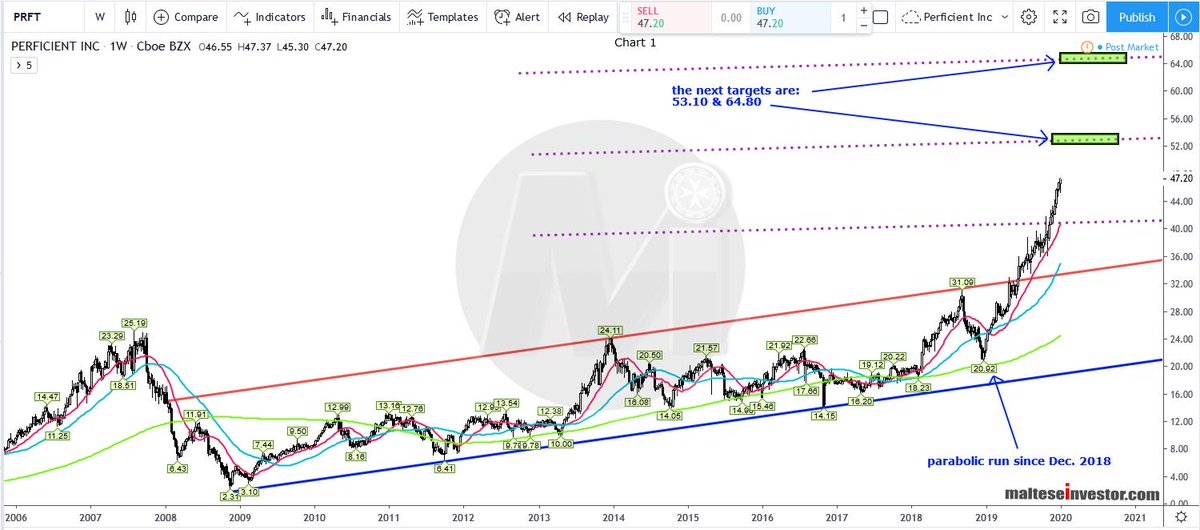
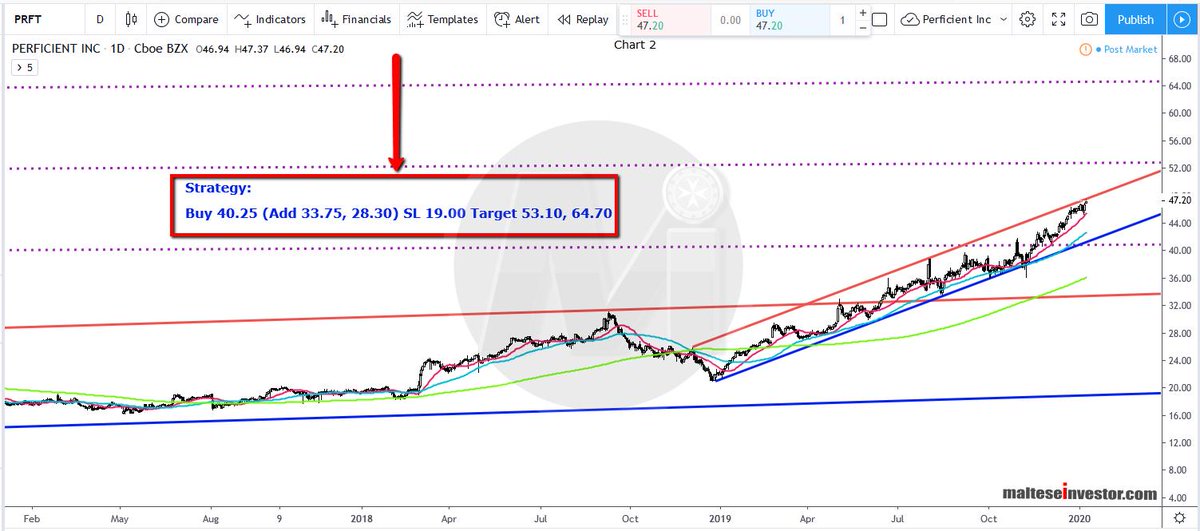
Analysis: #NASDAQ $PRFT
Case 108 #Perficient Inc
DISCLAIMER: The analysis is strictly for educational purposes and should not be construed as an invitation to trade.
Thread 👇👇👇
#PRFT 1/3
Case 108 #Perficient Inc
DISCLAIMER: The analysis is strictly for educational purposes and should not be construed as an invitation to trade.
Thread 👇👇👇
#PRFT 1/3

Chart 1
Weekly Chart: A #parabolic move since Dec 2018 and so far no end insight to this strong #uptrend ending, however, sooner or later, it has to correct lower. The current upside target is 53.10 and a break and hold above targets 64.80.
PRFT 2/3
Weekly Chart: A #parabolic move since Dec 2018 and so far no end insight to this strong #uptrend ending, however, sooner or later, it has to correct lower. The current upside target is 53.10 and a break and hold above targets 64.80.
PRFT 2/3
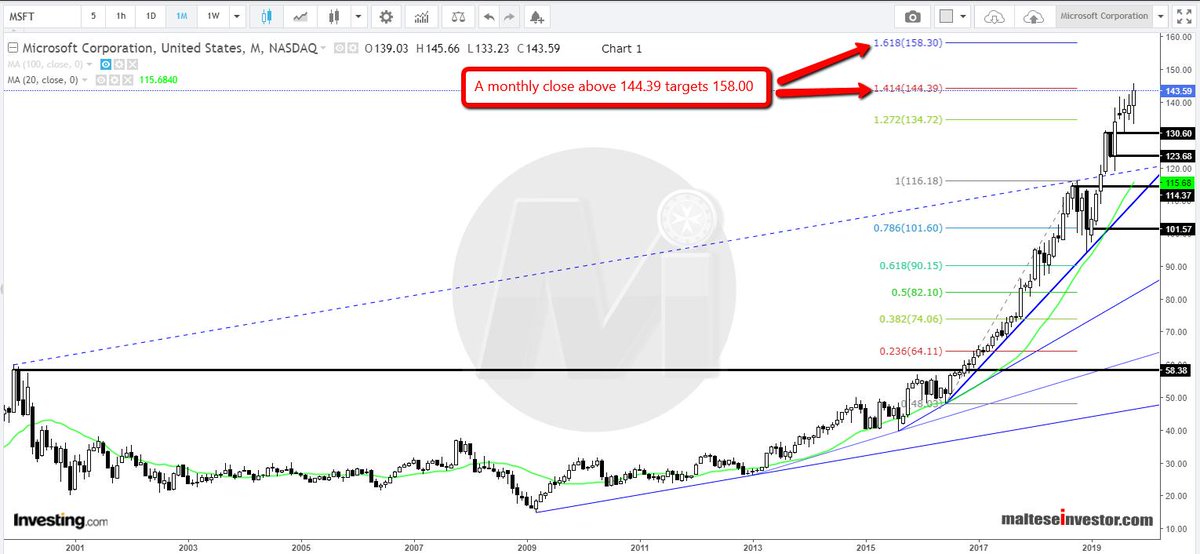
Analysis: #NASDAQ: #MSFT
Case 29 #Microsoft Corporation
DISCLAIMER: The analysis is strictly for educational purposes and should not be construed as an invitation to trade.
Thread 👇👇👇
MSFT 1/6
Case 29 #Microsoft Corporation
DISCLAIMER: The analysis is strictly for educational purposes and should not be construed as an invitation to trade.
Thread 👇👇👇
MSFT 1/6

Microsoft has been in a strong #uptrend since the break/close above the previous all time high of 59.97 which happened Oct 2016. A monthly close above 144.45 will eventually target 155.40 and 158.25 within 5-7 months.
MSFT 2/6
MSFT 2/6
Chart 1
Monthly Chart: The strong trend supported by #trendline support, TL #pivots and natural pivots. A close above 144.45 targets 158.25
MSFT 3/6
Monthly Chart: The strong trend supported by #trendline support, TL #pivots and natural pivots. A close above 144.45 targets 158.25
MSFT 3/6
Analysis: #NYSE: #KO
Case 13 #CocaCola Company
DISCLAIMER: The analysis is strictly for educational purposes and should not be construed as an invitation to trade.
Thread 👇👇👇
1/7
Case 13 #CocaCola Company
DISCLAIMER: The analysis is strictly for educational purposes and should not be construed as an invitation to trade.
Thread 👇👇👇
1/7
Coca-Cola has been in a strong #uptrend since March 2009, the high of $44.47 (March 1998) was finally overcome in October 2014 recording a new all time high of $44.87. Since 2019 the uptrend has been fortified. .......
2/7
2/7
.... Buying and holding for the short and long term will workout well and holding this stock pays a good #dividends. Only a close below $33.00 would turn the trend bearish.
3/7
3/7
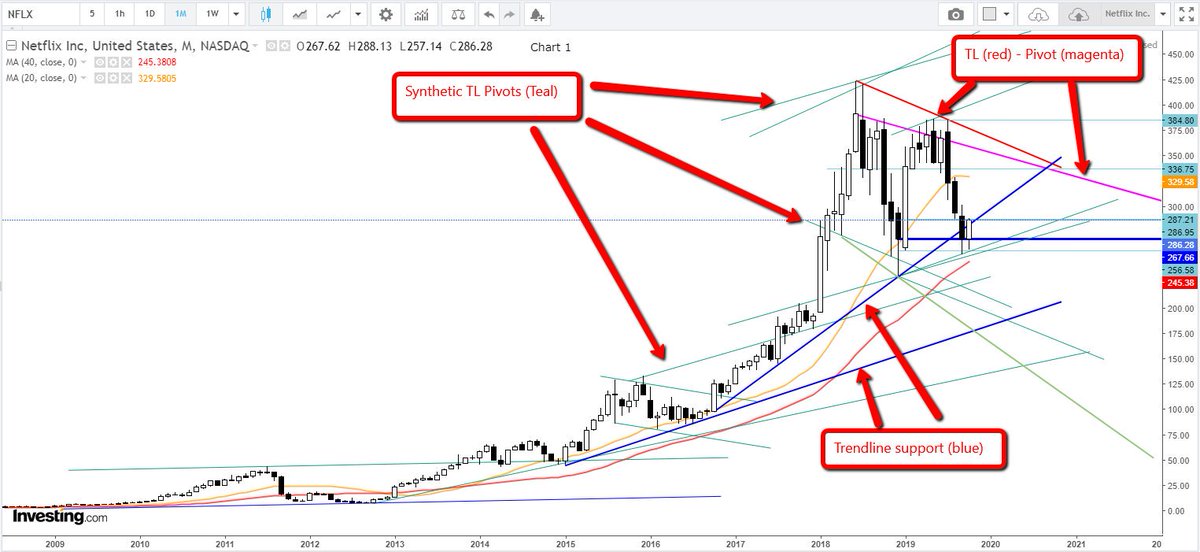
Analysis: #NASDAQ: #NFLX
Case 13 #Netflix Inc
DISCLAIMER: The analysis is strictly for educational purposes and should not be construed as an invitation to trade.
Thread 👇👇👇
1/12
Case 13 #Netflix Inc
DISCLAIMER: The analysis is strictly for educational purposes and should not be construed as an invitation to trade.
Thread 👇👇👇
1/12
A strong #uptrend that began in 2013 and peaked at a $423.31 in June 2018 and ever since then downside pressure has been building especially around $385.00 level. The trend is still healthily #bullish - for now a broad range is in play.
2/12
2/12
Chart 1
Monthly Chart: Synthetic #trendline pivots have been calculated over various peaks and troughs. A trendline and trendline #pivot mark the upper #resistance boundaries. Trendline #supports have also been added.
3/12
Monthly Chart: Synthetic #trendline pivots have been calculated over various peaks and troughs. A trendline and trendline #pivot mark the upper #resistance boundaries. Trendline #supports have also been added.
3/12

#Nifty50 Index chart shows "Step and Stairway pattern"

Classic Bullish Reversal #Nifty

HangSeng too showing Trend Continuation Bullish reversal pattern..

