Discover and read the best of Twitter Threads about #infographics
Most recents (24)

Announcement: After a successful #CostOfLivingCrisis support period, Rebuilding Heritage has now drawn to a close.
❤️Thank you to our funder, @HeritageFundUK, our partners @Heritage_NGOs @Heritage @CreativeUtdUK, @CIOFtweets, @CloreLeadership, @Media_Trust and many other contributors for making the #RebuildingHeritage programme such a resounding success.
Our final resource sets offer insight into what the programme accomplished during its final phase (Nov 22 - April 23) and what we learned.
rebuildingheritage.org.uk/resources/
rebuildingheritage.org.uk/resources/

🧵Content Marketing: Fueling Engagement & Brand Growth🌱
Content marketing is about creating and distributing valuable, relevant & consistent content to attract and retain your audience. Let's dive into some powerful examples & best practices!✨
#ContentMarketing
Content marketing is about creating and distributing valuable, relevant & consistent content to attract and retain your audience. Let's dive into some powerful examples & best practices!✨
#ContentMarketing
1️⃣ 📝Blogging: Inform, Educate, Inspire📚
Blogs are a cornerstone of content marketing, providing in-depth information on topics relevant to your audience.
Example: @Buffer's blog offers actionable advice on social media, marketing & productivity.
#Blogging #DigitalMarketing
Blogs are a cornerstone of content marketing, providing in-depth information on topics relevant to your audience.
Example: @Buffer's blog offers actionable advice on social media, marketing & productivity.
#Blogging #DigitalMarketing
2️⃣ 🎥Video Content: Engaging Visual Storytelling📹
Videos can convey complex ideas in a relatable & engaging format, from tutorials to product demos.
Example: @Moz's Whiteboard Friday series simplifies SEO concepts with concise explanations & visuals.
#VideoContent
Videos can convey complex ideas in a relatable & engaging format, from tutorials to product demos.
Example: @Moz's Whiteboard Friday series simplifies SEO concepts with concise explanations & visuals.
#VideoContent

Thank you to the @IPCC_CH's 700+ experts from 90 nations for completing #AR6. A multilateral tour de force of #ClimateScience.
Here are 5 #infographics that help explain the individual reports captured in this #IPCC cycle.
A synthesis of the synthesis 🤔 is in the works!
Here are 5 #infographics that help explain the individual reports captured in this #IPCC cycle.
A synthesis of the synthesis 🤔 is in the works!


1) Global Warming of 1.5°C (2018) #SR15
ipcc.ch/report/infogra…
Working with @SISeneviratne, @JoeriRogelj, @MelichatGo and countless others. We translated into five languages aside from English: Mandarin, Arabic, Russian, Spanish and French @BMHayward
ipcc.ch/report/infogra…
Working with @SISeneviratne, @JoeriRogelj, @MelichatGo and countless others. We translated into five languages aside from English: Mandarin, Arabic, Russian, Spanish and French @BMHayward


What have UK corporation tax rates and revenues been doing for the last fifty years? This:
#infographics #nerdery
#infographics #nerdery

How does that compare with France and the US?

And here's a full interactive version that lets you compare rates and revenues for any countries across the OECD: taxpolicy.org.uk/corp_tax_histo…

1/ Eli5DeFi is a collaborative effort to educate people about #DeFi, #Cryptocurrency, and #Blockchain with infographics and visual guides.
Please visit our @NotionHQ page below for Eli5DeFi portfolios, contact, and research resources.
#visualguide
notion.so/eli5defi/Eli5D…
Please visit our @NotionHQ page below for Eli5DeFi portfolios, contact, and research resources.
#visualguide
notion.so/eli5defi/Eli5D…
2/ To find our unrolled #VisualGuide #infographics🧵, you can check our @typefully page
typefully.com/eli5_defi
typefully.com/eli5_defi
3/ All of our publications are free and you can also download them (.pdf files) in our @googledrive link below:
drive.google.com/drive/folders/…
drive.google.com/drive/folders/…

🧵Are you ready for the #PremiereLeague to kick off? Who do you think will win it all this year? Defending champions @ManCity are the favorites to win the league once more.
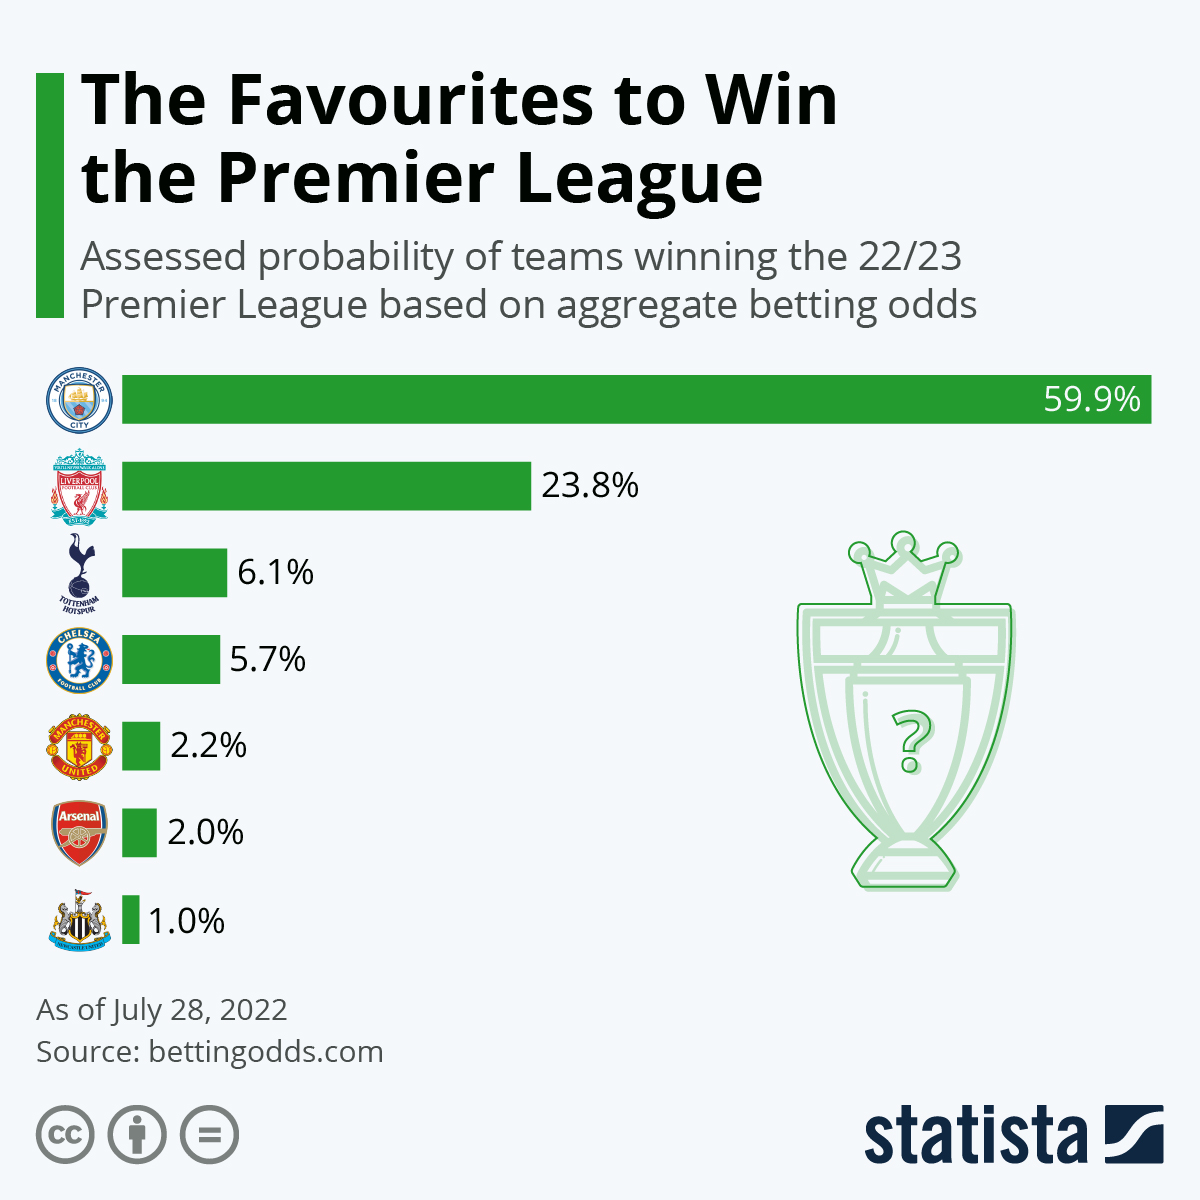
#ManCity's Premier League title last year marked the club’s fourth title in the past five years and its sixth in both, the Premier League and the Abu Dhabi era.

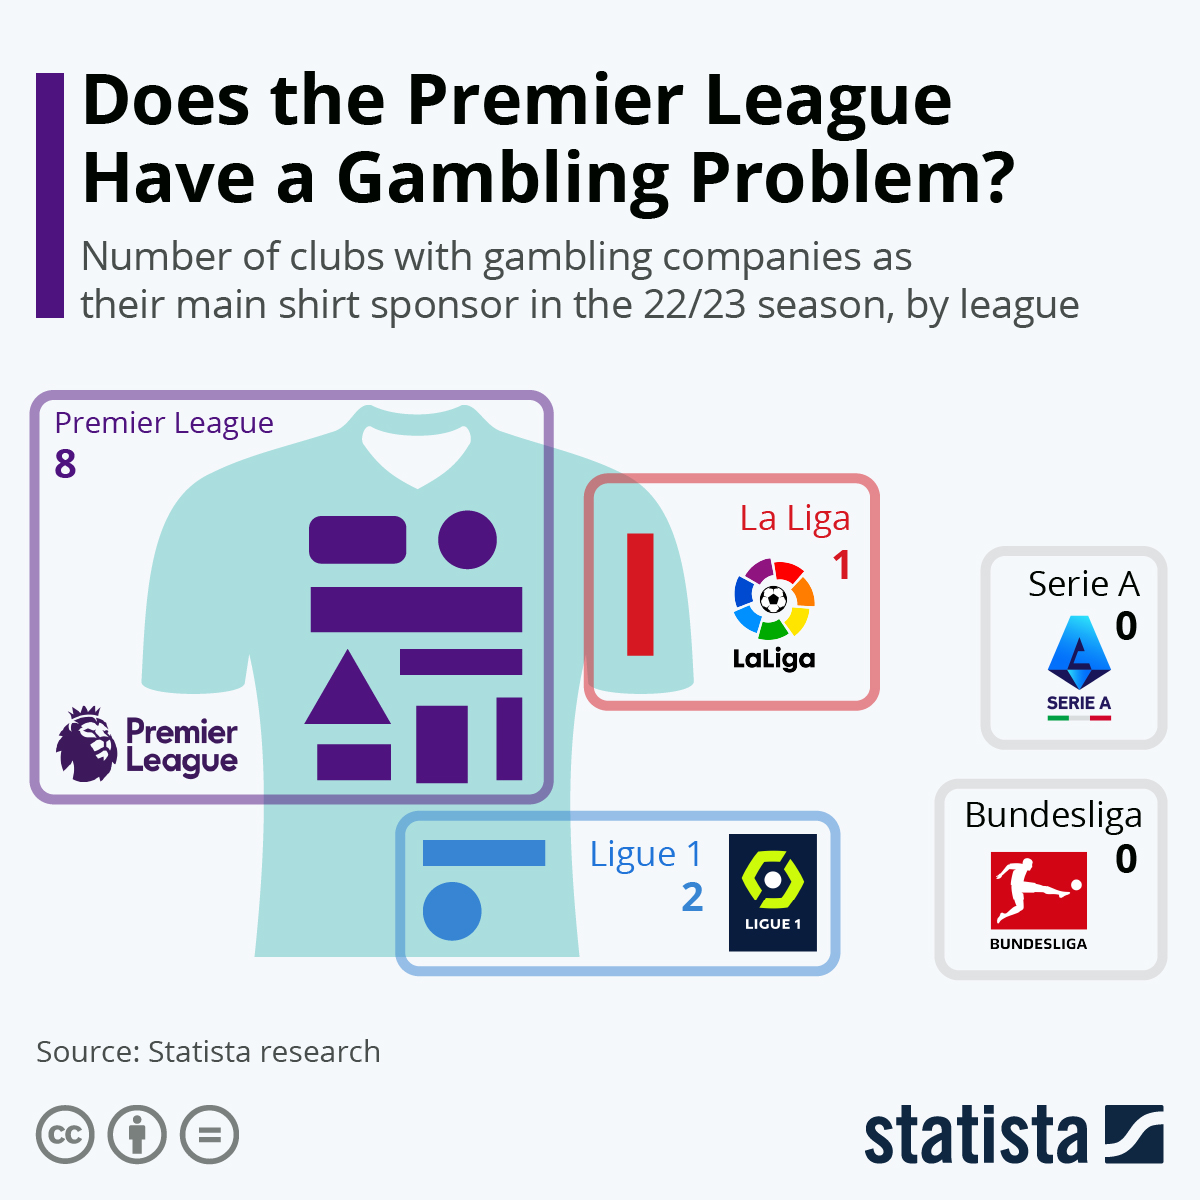
Do you bet on sports? If you've watched a Premier League game on TV in the UK in the last decade, you will have undoubtedly been met with such phrases as 'bet in play now', 'latest live odds' or '£50 free bet' during the game.

🧵 Tonight's SFI Community Lecture by 2x Miller Scholar @Andrea_Wulf begins in just a few minutes!
Follow this thread for the streaming link and highlights from the talk. (Sorry, but this recording will not be available to view afterward...)
Follow this thread for the streaming link and highlights from the talk. (Sorry, but this recording will not be available to view afterward...)
Talk starts now with an intro by SFI Prof @C4_Computation:
Q - Flack: "Some of you might wonder how a talk on Humboldt connects to #ComplexityScience."
A - Humboldt: "Knowledge of the chain of connection....the perception of these relations."
Q - Flack: "Some of you might wonder how a talk on Humboldt connects to #ComplexityScience."
A - Humboldt: "Knowledge of the chain of connection....the perception of these relations."
Who was #AlexanderVonHumboldt?
"A man who was so restless he said he was chased by 10,000 pigs... He spent his entire inheritance on a five-year voyage of South America. They called him 'The Shakespeare of the Sciences.'"
- @andrea_wulf
"A man who was so restless he said he was chased by 10,000 pigs... He spent his entire inheritance on a five-year voyage of South America. They called him 'The Shakespeare of the Sciences.'"
- @andrea_wulf

1/ Eli5DeFi is a collaborative effort to educate people about #DeFi, #Cryptocurrency and #Blockchain with infographics and visual guides.
Our #Notion page is a one-stop place for curated DeFi information and resources
bit.ly/3zQHouR
Our #Notion page is a one-stop place for curated DeFi information and resources
bit.ly/3zQHouR
2/ To find our unrolled #infographics🧵, you can check our @typefully page below:
typefully.com/eli5_defi
typefully.com/eli5_defi
3/ Our first #visualguide is about @CurveFinance Primer, including @ConvexFinance and #CurveWars narration. Check the🧵for more details!
$CRV $veCRV $CVX $crvCVX
#Curve #Convex #DeFi #YieldFarming
$CRV $veCRV $CVX $crvCVX
#Curve #Convex #DeFi #YieldFarming

Making figures for publications is an often neglected stage - and in many situations we resolve to simplest figures made in PowerPoint etc. Aa a #science_designer I'm often commissioned to revamp such figures. Here's an example processes. #sciart #viz thread of 10

0) It's a figure I'm working on with other colleagues - the initial version (LEFT) was "OK" - it would do in terms of conveying messages (if accompanied with a proper label). MIDDLE = first iteration. RIGHT = close to finish. It still needs some work but:
1) Don't underestimate the power of small things, like e.g. white space - your content does not have to be crammed and squeezed as tightly as possible


Daily Bookmarks to GAVNet 03/21/2022 greeneracresvaluenetwork.wordpress.com/2022/03/21/dai…
What the Fukushima Nuclear Disaster Reveals About Accepting Risk - The Atlantic
theatlantic.com/ideas/archive/…
#RiskManagement, #FukushimaNuclearDisaster, #PublicSafety
theatlantic.com/ideas/archive/…
#RiskManagement, #FukushimaNuclearDisaster, #PublicSafety

And here we go...
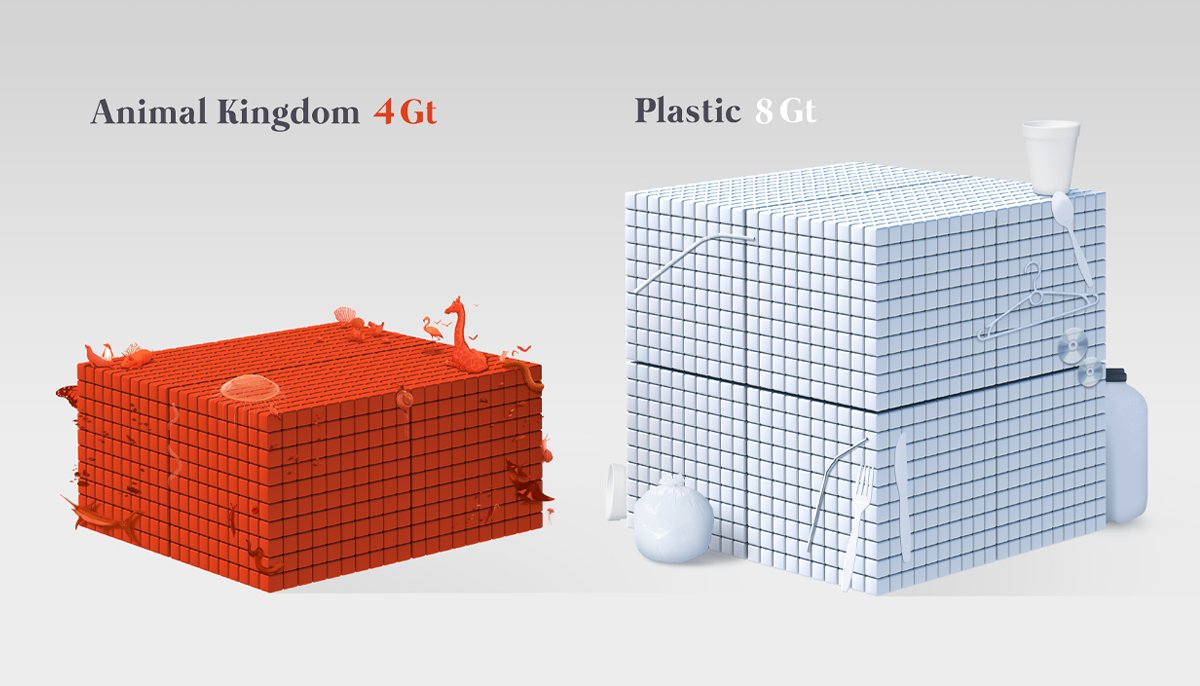
PART TWO: Visualizing the Accumulation of Human-Made Mass ⚖️🏗️🛠️🧱🔩 (incl. 🧵) #anthropogenicmass #biomass #construction #mining #dataviz #infographics #sciart #datavisualization #visualjournalism #science #scicomm #scienceillustration #anthropocene
PART TWO: Visualizing the Accumulation of Human-Made Mass ⚖️🏗️🛠️🧱🔩 (incl. 🧵) #anthropogenicmass #biomass #construction #mining #dataviz #infographics #sciart #datavisualization #visualjournalism #science #scicomm #scienceillustration #anthropocene

Since 1900, we've been making a LOT of stuff...and it's been piling up. In 2020, the material output of humans on Earth SURPASSED the total (dry) weight of all living things on Earth!
One grim part to this story (there's many 😵💫) is that we've now produced double the weight of plastic than the entire Animal Kingdom.

1/ “Visual representations are time-efficient and designed to engage the reader's visual processing capacity and decrease #cognitive workload.”
How do you start w/ #infographics & visual abstracts?!
🧵 on Rip Out w/ @AylC1989 @AndrewMIbrahim & Amy Ou ! doi.org/10.4300/JGME-D…
How do you start w/ #infographics & visual abstracts?!
🧵 on Rip Out w/ @AylC1989 @AndrewMIbrahim & Amy Ou ! doi.org/10.4300/JGME-D…

2/ 1st pick a design software and stick with it!
Pro-tip: powerpoint works great!
Once you get the basics of chosen software, try to advance your skills with tutorials (ex: use PowerPoint to create animations, complex diagrams, etc)
Pro-tip: powerpoint works great!
Once you get the basics of chosen software, try to advance your skills with tutorials (ex: use PowerPoint to create animations, complex diagrams, etc)

3/ We break down “How to start today” in the Rip Out into (1) content and (2) design
Both are key! Or else, you either get a pretty image (!) or an #invisible message (!)
👇🏾 I will highlight a few key point!
Both are key! Or else, you either get a pretty image (!) or an #invisible message (!)
👇🏾 I will highlight a few key point!


Thanks for being brave and helping us learn @AryaCampaigns! Here's my redesign!
Your focus is ACCESS. Currently that is buried and obscured. Suggest a #stackedbarchart #infographic to show your avg access, then break down by low and high health literate.
cont...
Your focus is ACCESS. Currently that is buried and obscured. Suggest a #stackedbarchart #infographic to show your avg access, then break down by low and high health literate.
cont...

honestly, in this case, your graphics are fighting your message, and I'd just get down to clearly showing your data. I'd also rather have labels than icons here, because I'm struggling to understand exactly what some of the icons are.
cont...
cont...
Possible to bring some images back in what I've labled demographics, but you may want to ask yourself what those are doing to help your message. Some of the side info could be cut.
#Design for #Sciviz Tip 1:
Keep it simple (as you can). No.1 issue I run into with clients is they want to put every bit of their research in every image. Maybe ok for numbered figs, but not in your visual abstract, not in your PPT presentation!
Keep it simple (as you can). No.1 issue I run into with clients is they want to put every bit of their research in every image. Maybe ok for numbered figs, but not in your visual abstract, not in your PPT presentation!
At each step, whether working with a #sciart designer, or DIY, ask yourself "what is most important here" and "how can I #communicate that most clearly?"
Ask yourself what is noise in your message, and may prevent your audience from understanding (or even reading) your work. If it is unreadable, there is NO POINT in having every detail in there!
Daily Bookmarks to GAVNet 05/09/2021 greeneracresvaluenetwork.wordpress.com/2021/05/09/dai…
Deflation and Disruption
dailyreckoning.com/deflation-and-…
#deflation #disruption #money #velocity #TheFed #printing
dailyreckoning.com/deflation-and-…
#deflation #disruption #money #velocity #TheFed #printing
How to build an interactive infographic from scratch
hackernoon.com/how-to-build-a…
#HowTo #infographics #interactive
hackernoon.com/how-to-build-a…
#HowTo #infographics #interactive

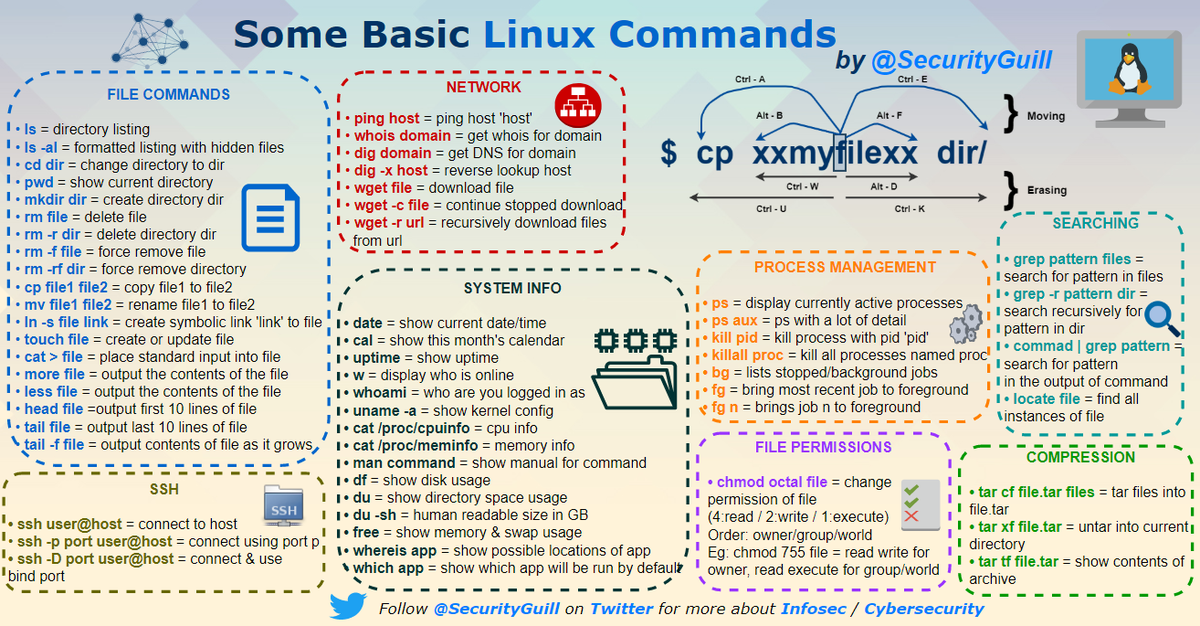
This thread brings together all my #infographics until today (2years of work).
These are all infographics about #infosec 🔐
Feel free to share this tweet if you think it may be useful for your #community 📚
Follow me ➡ @SecurityGuill fore more about #security #hacking #news
These are all infographics about #infosec 🔐
Feel free to share this tweet if you think it may be useful for your #community 📚
Follow me ➡ @SecurityGuill fore more about #security #hacking #news


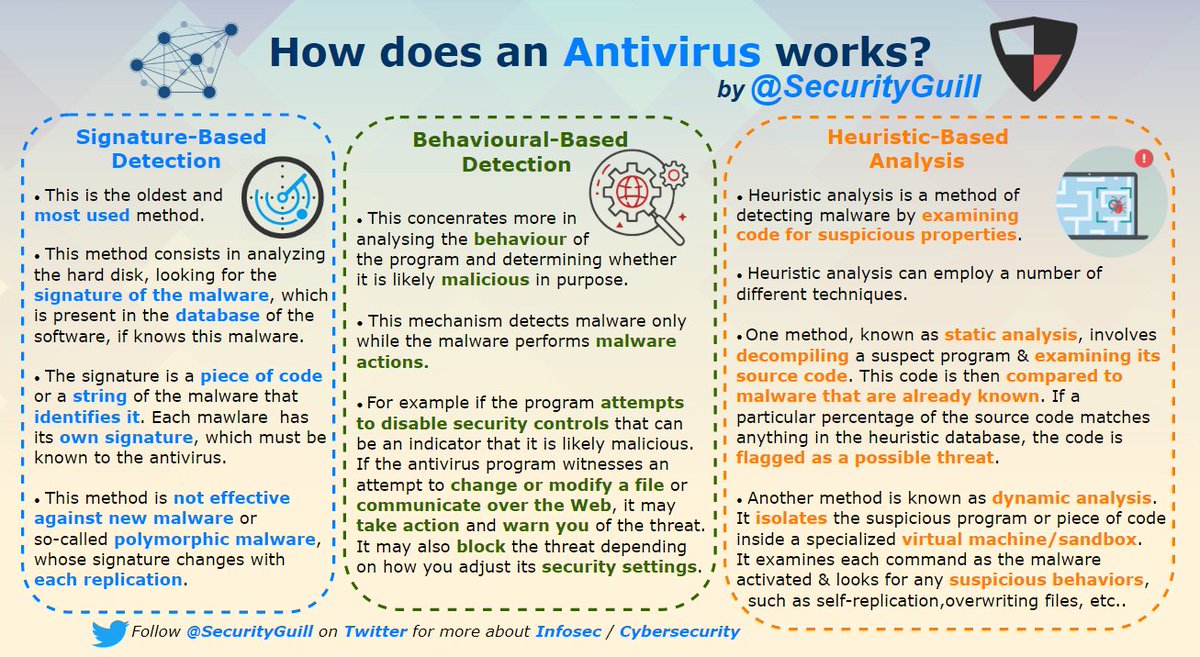
How does an #Antivirus works?

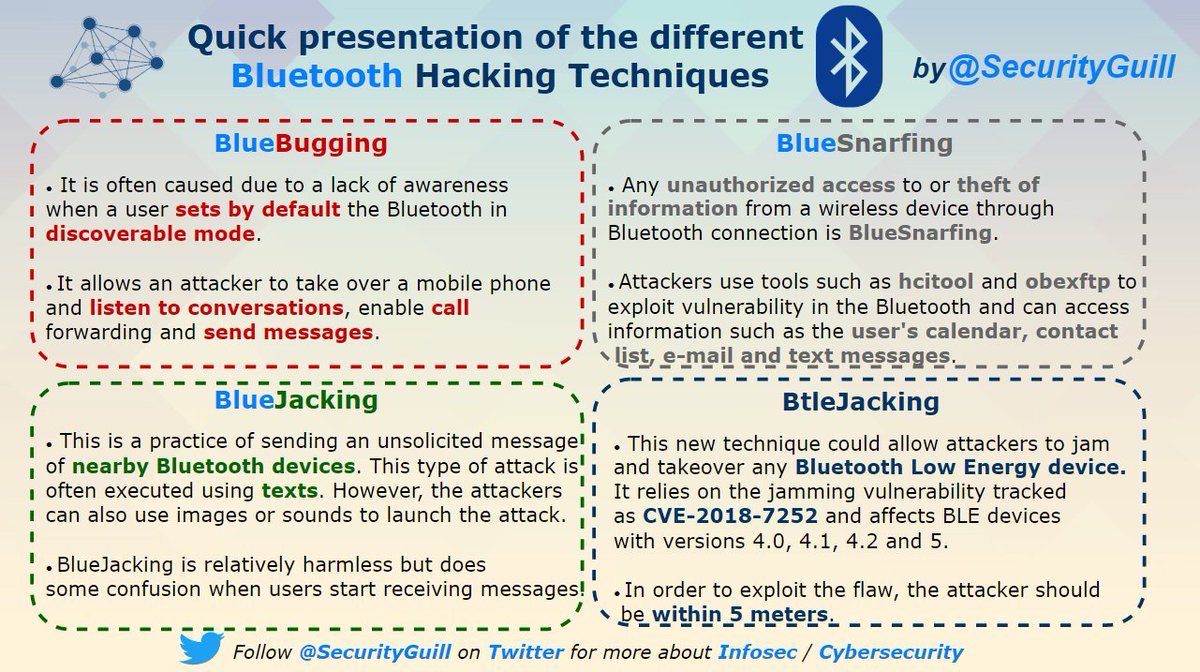
Quick presentation of the different #Bluetooth Hacking Techniques

Daily Bookmarks to GAVNet 02/26/2021 greeneracresvaluenetwork.wordpress.com/2021/02/26/dai…
Gulf Stream System at its weakest in over a millennium
phys.org/news/2021-02-g…
#ocean, #GulfStream, #currents
phys.org/news/2021-02-g…
#ocean, #GulfStream, #currents
Steve Hilton on Twitter and ThreadReader
threadreaderapp.com/thread/1364789…
#PartisanPolitics #EconomicRecovery #StimulusBill #legislation
threadreaderapp.com/thread/1364789…
#PartisanPolitics #EconomicRecovery #StimulusBill #legislation

I'm doing a "virtual" visiting scholar stint w/ @ubcMedCHES this week. Today was a day full of exciting new connections & great discussions.
Ended my day with a talk: "Digitizing Health Professions Education via #SoMe
I am now going to TWEET my lecture as a #tweetorial.
Ended my day with a talk: "Digitizing Health Professions Education via #SoMe
I am now going to TWEET my lecture as a #tweetorial.

I began by situation myself as the current Assistant Dean of #FacDev within the @MacHealthSci Faculty. Much of my content would eventually revolve around what I've learned from #FOAMed and how it's translated to our recent digital transformation of @MacPFD.


Shout out to @sherbino who opened my eyes to @Twitter as a community of practice for myself as a clinician AND an educator. The #FOAMed, #MedTwitter, and #MedEd tweeps have been instrumental in helping me develop as a practitioner, scholar, and now faculty developer.


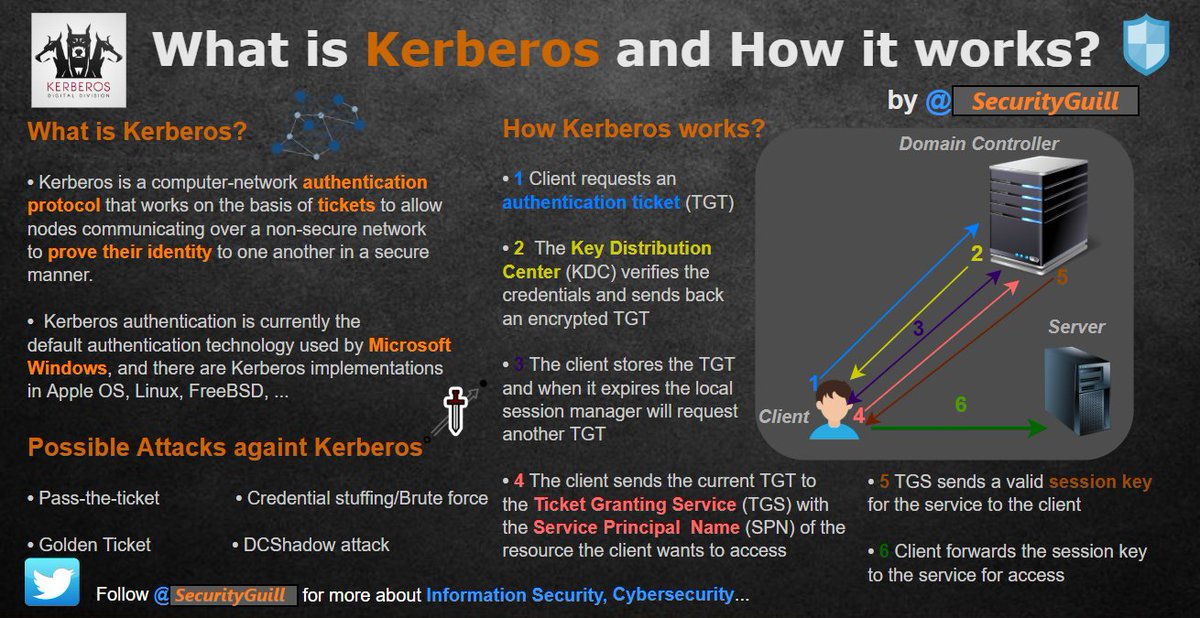
This thread updated includes all my #infographics so far, they present different terms related to Information Security 🔐
It's an easy way to learn new things 📖
I hope it will be useful to the community 🌐
RT appreciated 🔁
Follow me ➡️ @SecurityGuill for more about #infosec
It's an easy way to learn new things 📖
I hope it will be useful to the community 🌐
RT appreciated 🔁
Follow me ➡️ @SecurityGuill for more about #infosec


We’re about to start live-tweeting our Summer Student Showcase: Visualizing Science virtual event! Check here for tweets on visual communication research and how it applies to #scicomm, #infographics, #branding, and #socialmedia! ⬇️ @ComSciConCAN @ComSciConQC @AlexGelle
Give us a follow, tag us @designsthatcell and use #DTCSummerShowcase to let us know what you think about the event! We'd love to connect with you 🤗
Our founder, @NersesianSarah, is opening today’s event by introducing our summer internship program and today’s awesome speaker lineup! The intern program was developed to support undergraduate students who lost #research or #scicomm opportunities due to COVID-19 restrictions.

With just over a month left in 2020, let’s talk about the #designtrends we expect to see in 2020. I’ve noticed, and this is usually the case, a larger focus on animation this last year. Flat, #material animation especially 2D characters. Also there has been an increased
Social media focus on “lesson” #Instagram style posts with multiple screens. Hell I tried it myself to see how I would go about doing it. The good thing about these types of posts is that they actually do contain some good info, but I think the trend has hit its peak now.
Next year, I suspect the design world will get more into simple #motiongraphics, perhaps even the multi-screen style static pages we have seen but shorter, more focused animated style typography based animations as the tech becomes more widely available through phones and tablets
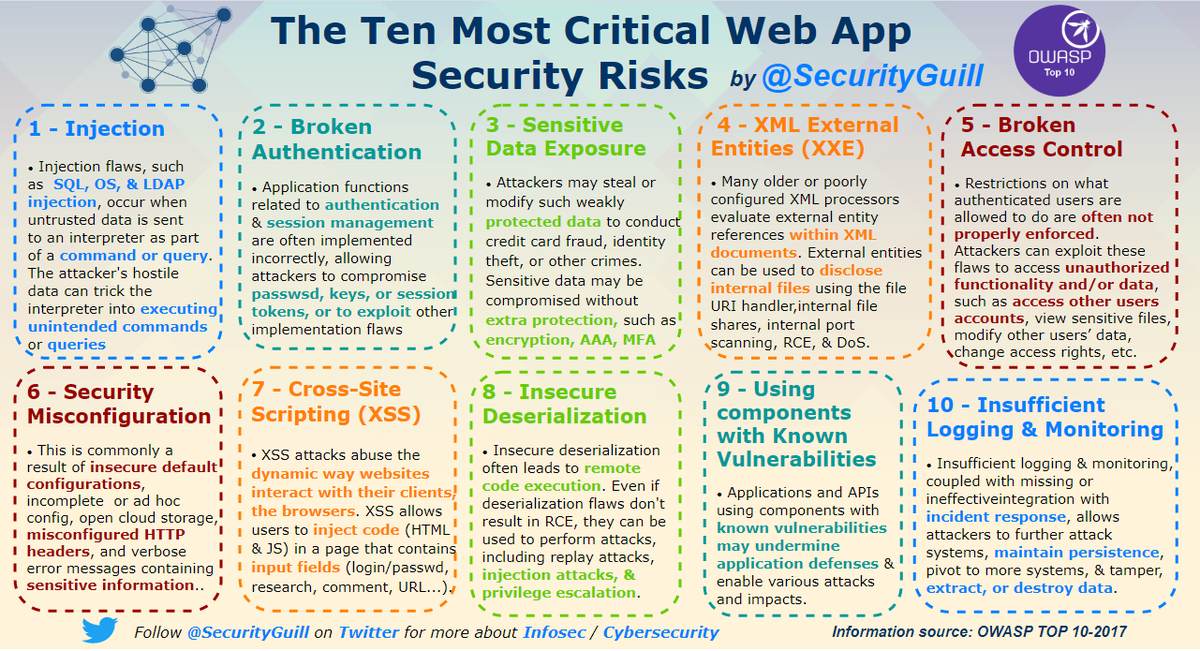
This thread updated includes all my #infographics so far, they present different terms related to Information Security 🔐
It's an easy way to learn new things 📖
I hope it will be useful to the community 🌐
RT appreciated 🔁
Follow me ➡️ @SecurityGuill for more about #infosec
It's an easy way to learn new things 📖
I hope it will be useful to the community 🌐
RT appreciated 🔁
Follow me ➡️ @SecurityGuill for more about #infosec


How does an Antivirus works?

Quick presentation of the different Bluetooth Hacking Techniques
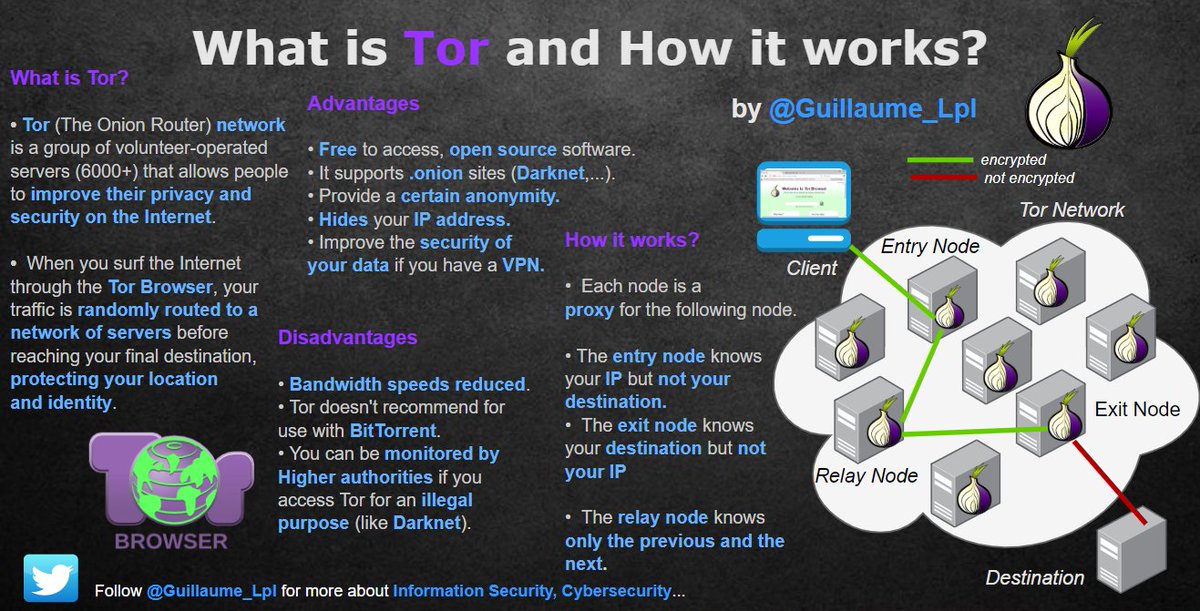
This thread includes all my #infographics so far, they present different terms related to Information Security 🔐
It's an easy way to learn new things 📖 I hope it will be useful to the community. RT appreciated 🌐
Follow me @Guillaume_Lpl for more about #infosec #cybersecurity
It's an easy way to learn new things 📖 I hope it will be useful to the community. RT appreciated 🌐
Follow me @Guillaume_Lpl for more about #infosec #cybersecurity

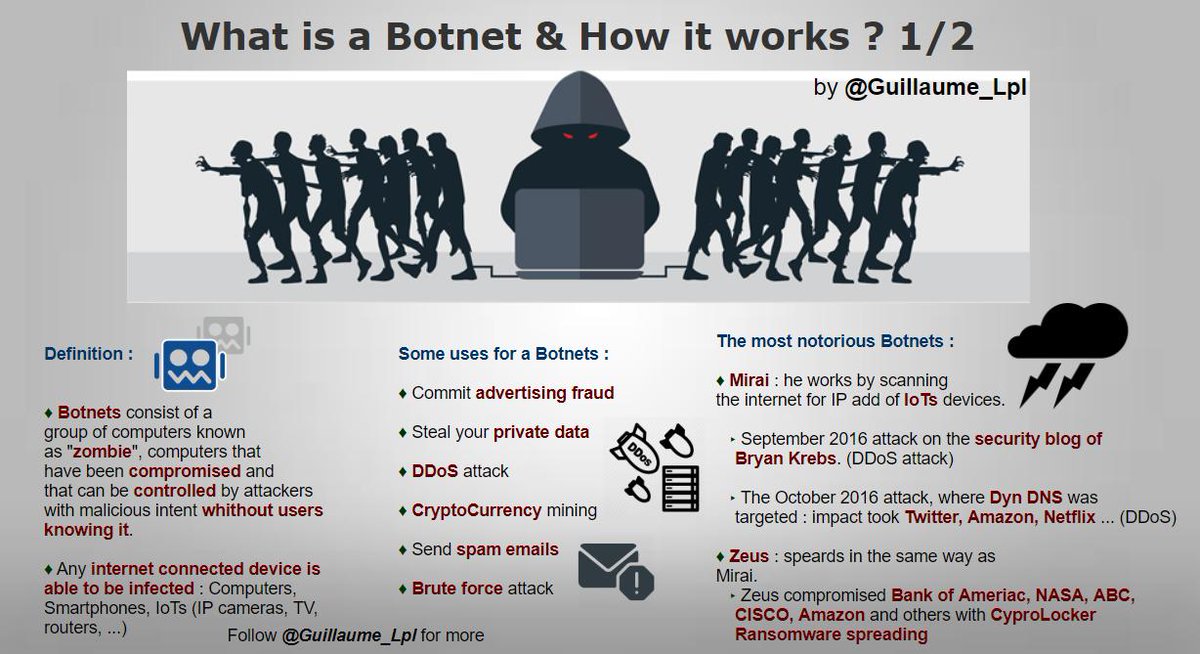
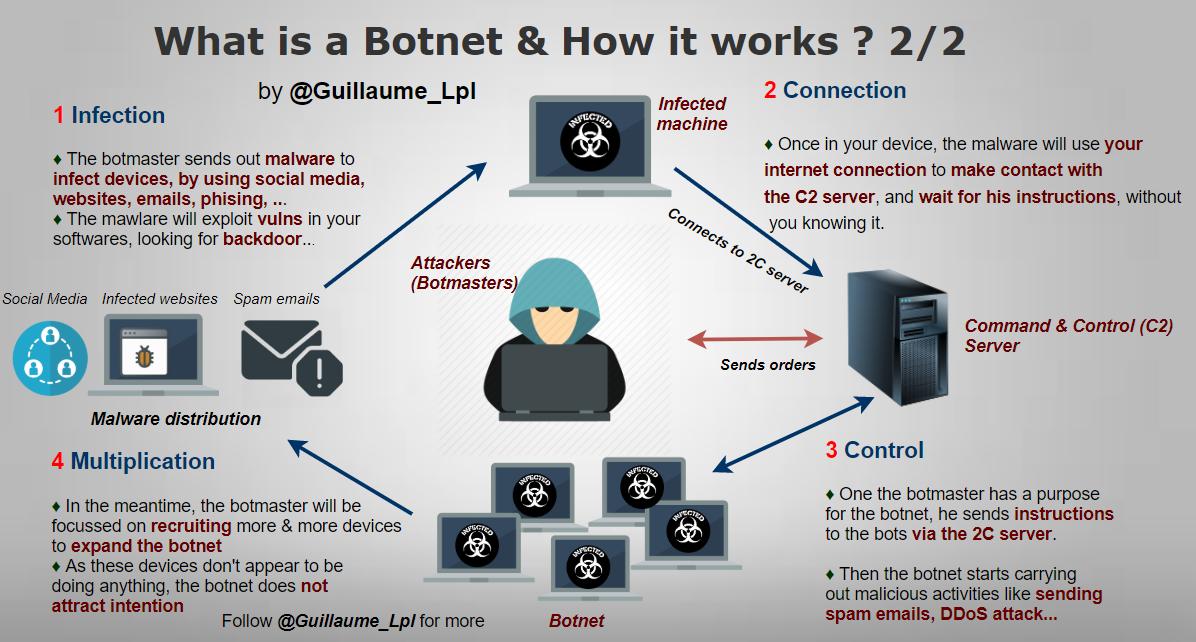
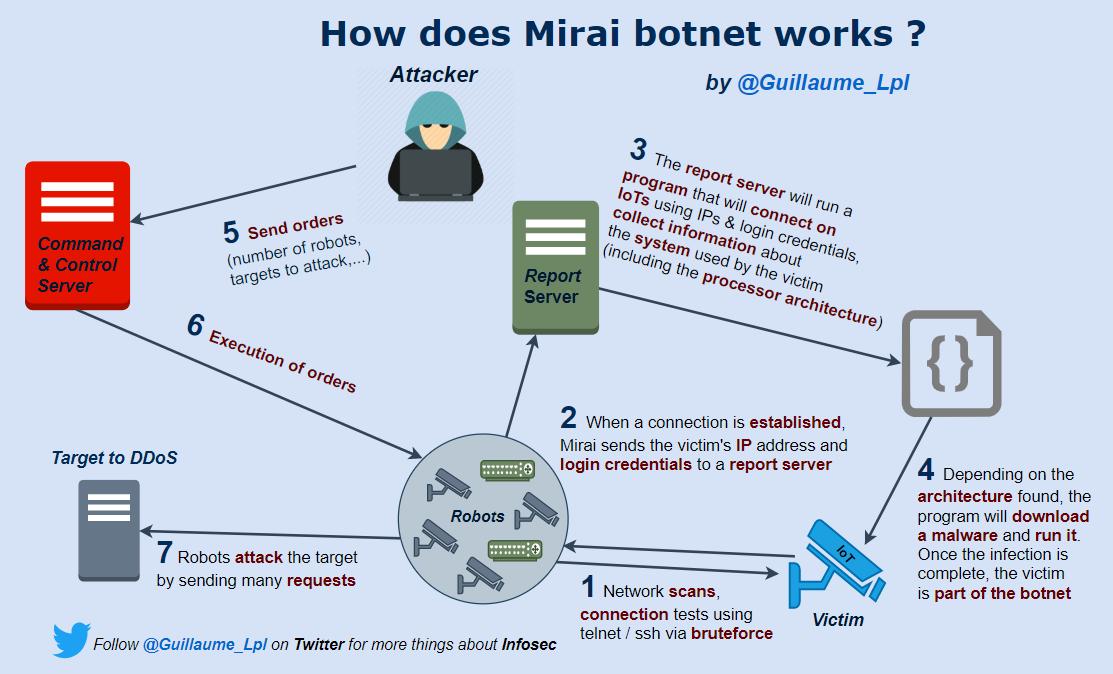
What is a Botnet & How ti works?
Follow me @Guillaume_Lpl for more about #infosec #cybersecurity #dataprivacy #ITsecurity #technology
Follow me @Guillaume_Lpl for more about #infosec #cybersecurity #dataprivacy #ITsecurity #technology
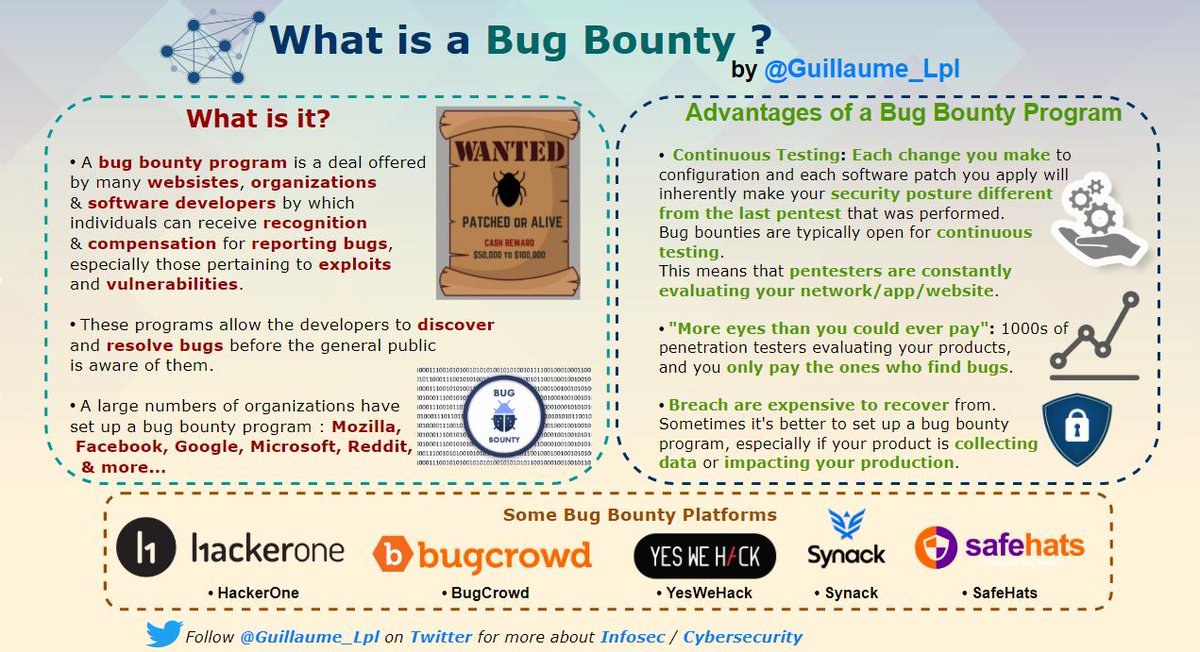
What is a Bug Bounty?
Follow me @Guillaume_Lpl for more about #infosec #cybersecurity #dataprivacy #ITsecurity #technology
Follow me @Guillaume_Lpl for more about #infosec #cybersecurity #dataprivacy #ITsecurity #technology
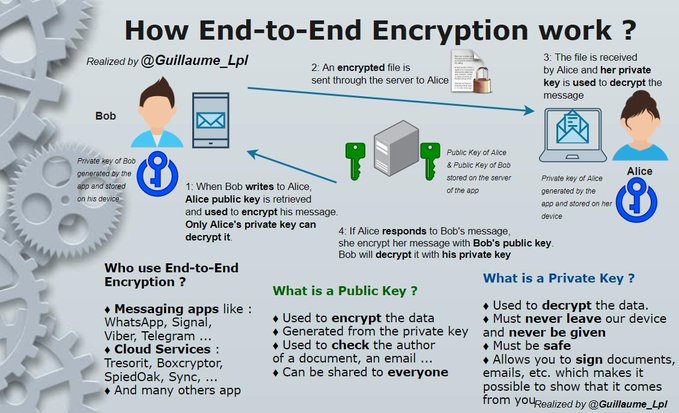
For those who want to learn about #infosec 🔐 here is a #thread that includes all my #infographics.
An easy way to learn new things 📖Feel free to share with your community🌐
Follow @Guillaume_Lpl for more things about #CyberSecurity #startup #ITsecurity #security #technologies
An easy way to learn new things 📖Feel free to share with your community🌐
Follow @Guillaume_Lpl for more things about #CyberSecurity #startup #ITsecurity #security #technologies

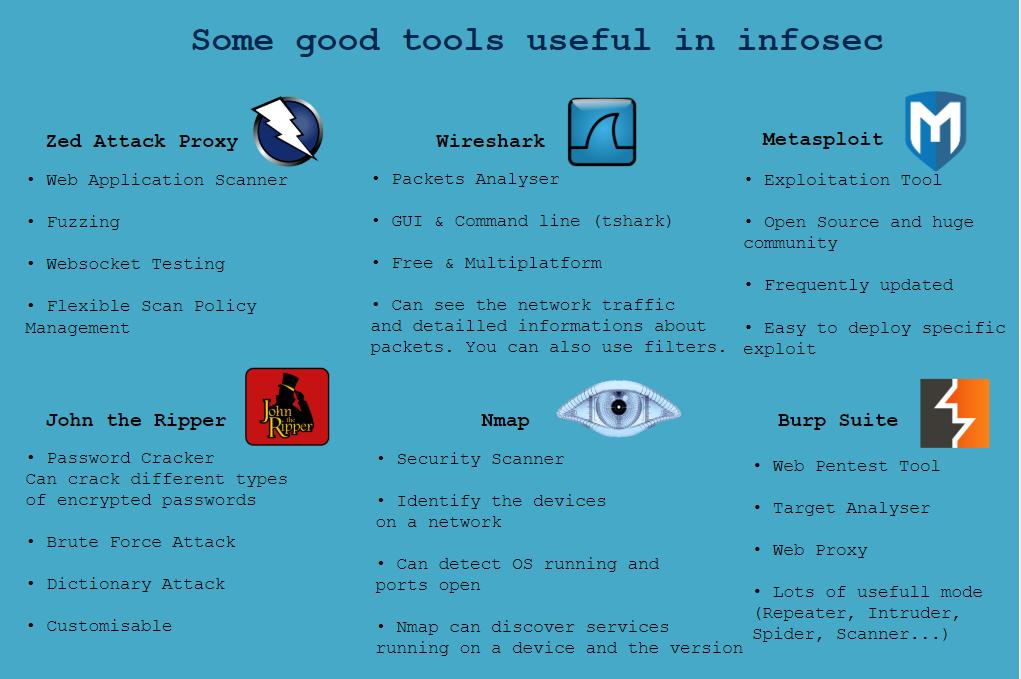
Some good tools useful in Infosec
Follow @Guillaume_Lpl for more things about #infosec #cybersecurity
Follow @Guillaume_Lpl for more things about #infosec #cybersecurity
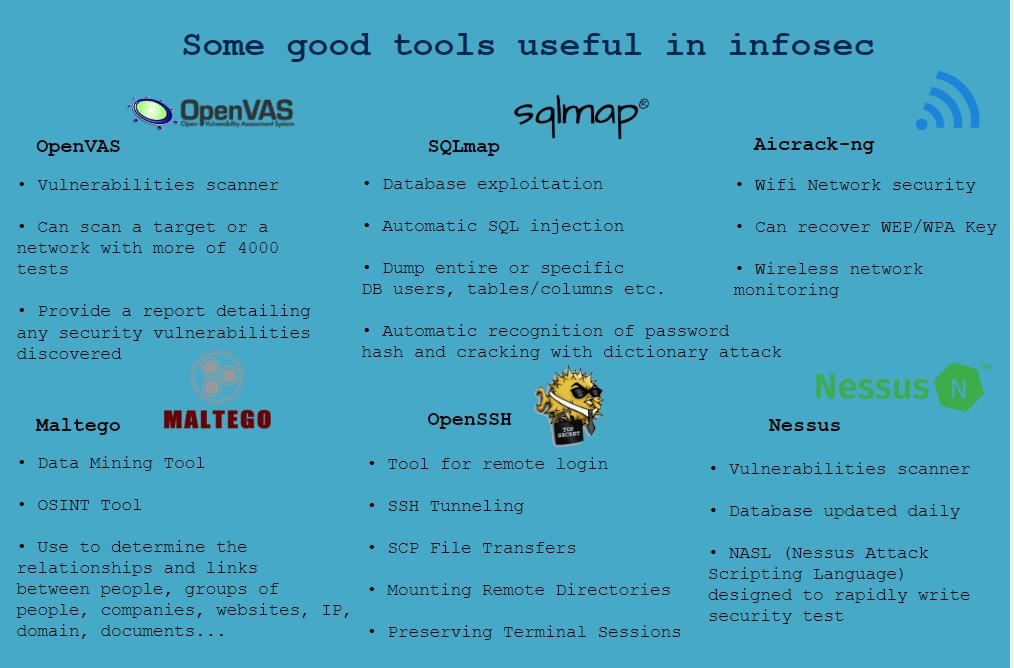
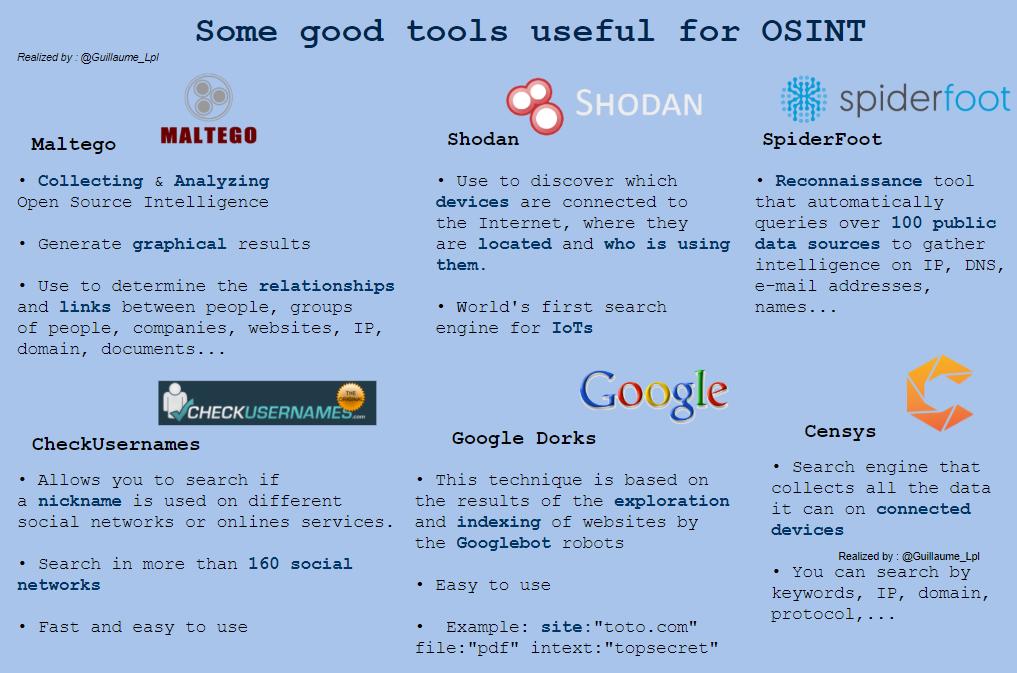
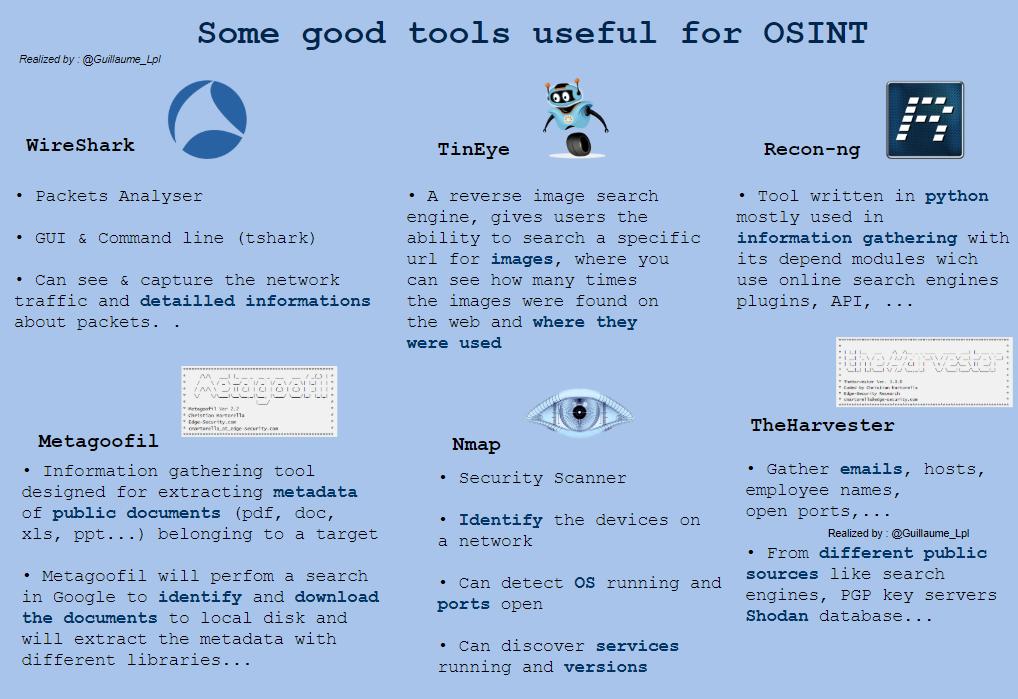
Some good tools useful for OSINT
Follow @Guillaume_Lpl for more things about #infosec #cybersecurity
Follow @Guillaume_Lpl for more things about #infosec #cybersecurity